Mediation of Glycemia Exposure in on Time-to-Retinopathy in Type 2 Diabetes
2025-08-18
Cohort Identification

- Subjects must have
- \(\ge 1\) DM Dx code or equivalent in pre-period to be included
- \(\ge 3\) HbA1c measurements in at least two distinct years, in the 5 years prior to blood sample collection
- In MVP, currently have a sample of 12,037 T2D subjects with methylation data and meet the inclusion criteria
Exposure Definitions

All exposures are defined using HbA1c measurements collected from five years prior up to and including the MVP sample collection date
- Mean HbA1c level
- Excess HbA1c level
- Threshold set at 6.1% HbA1c (see Miller and Orchard (2020))
- CV of HbA1c level
| Exposure | Mean | SD | 95%CI lb | 95%CI ub |
|---|---|---|---|---|
| Mean (%) | 7.36 | 1.27 | 5.60 | 10.50 |
| Excess (%) | 6.59 | 6.29 | 0.00 | 10.66 |
| CV | 0.10 | 0.08 | 0.02 | 0.30 |
HbA1c measurements below 4% and above 18% were excluded
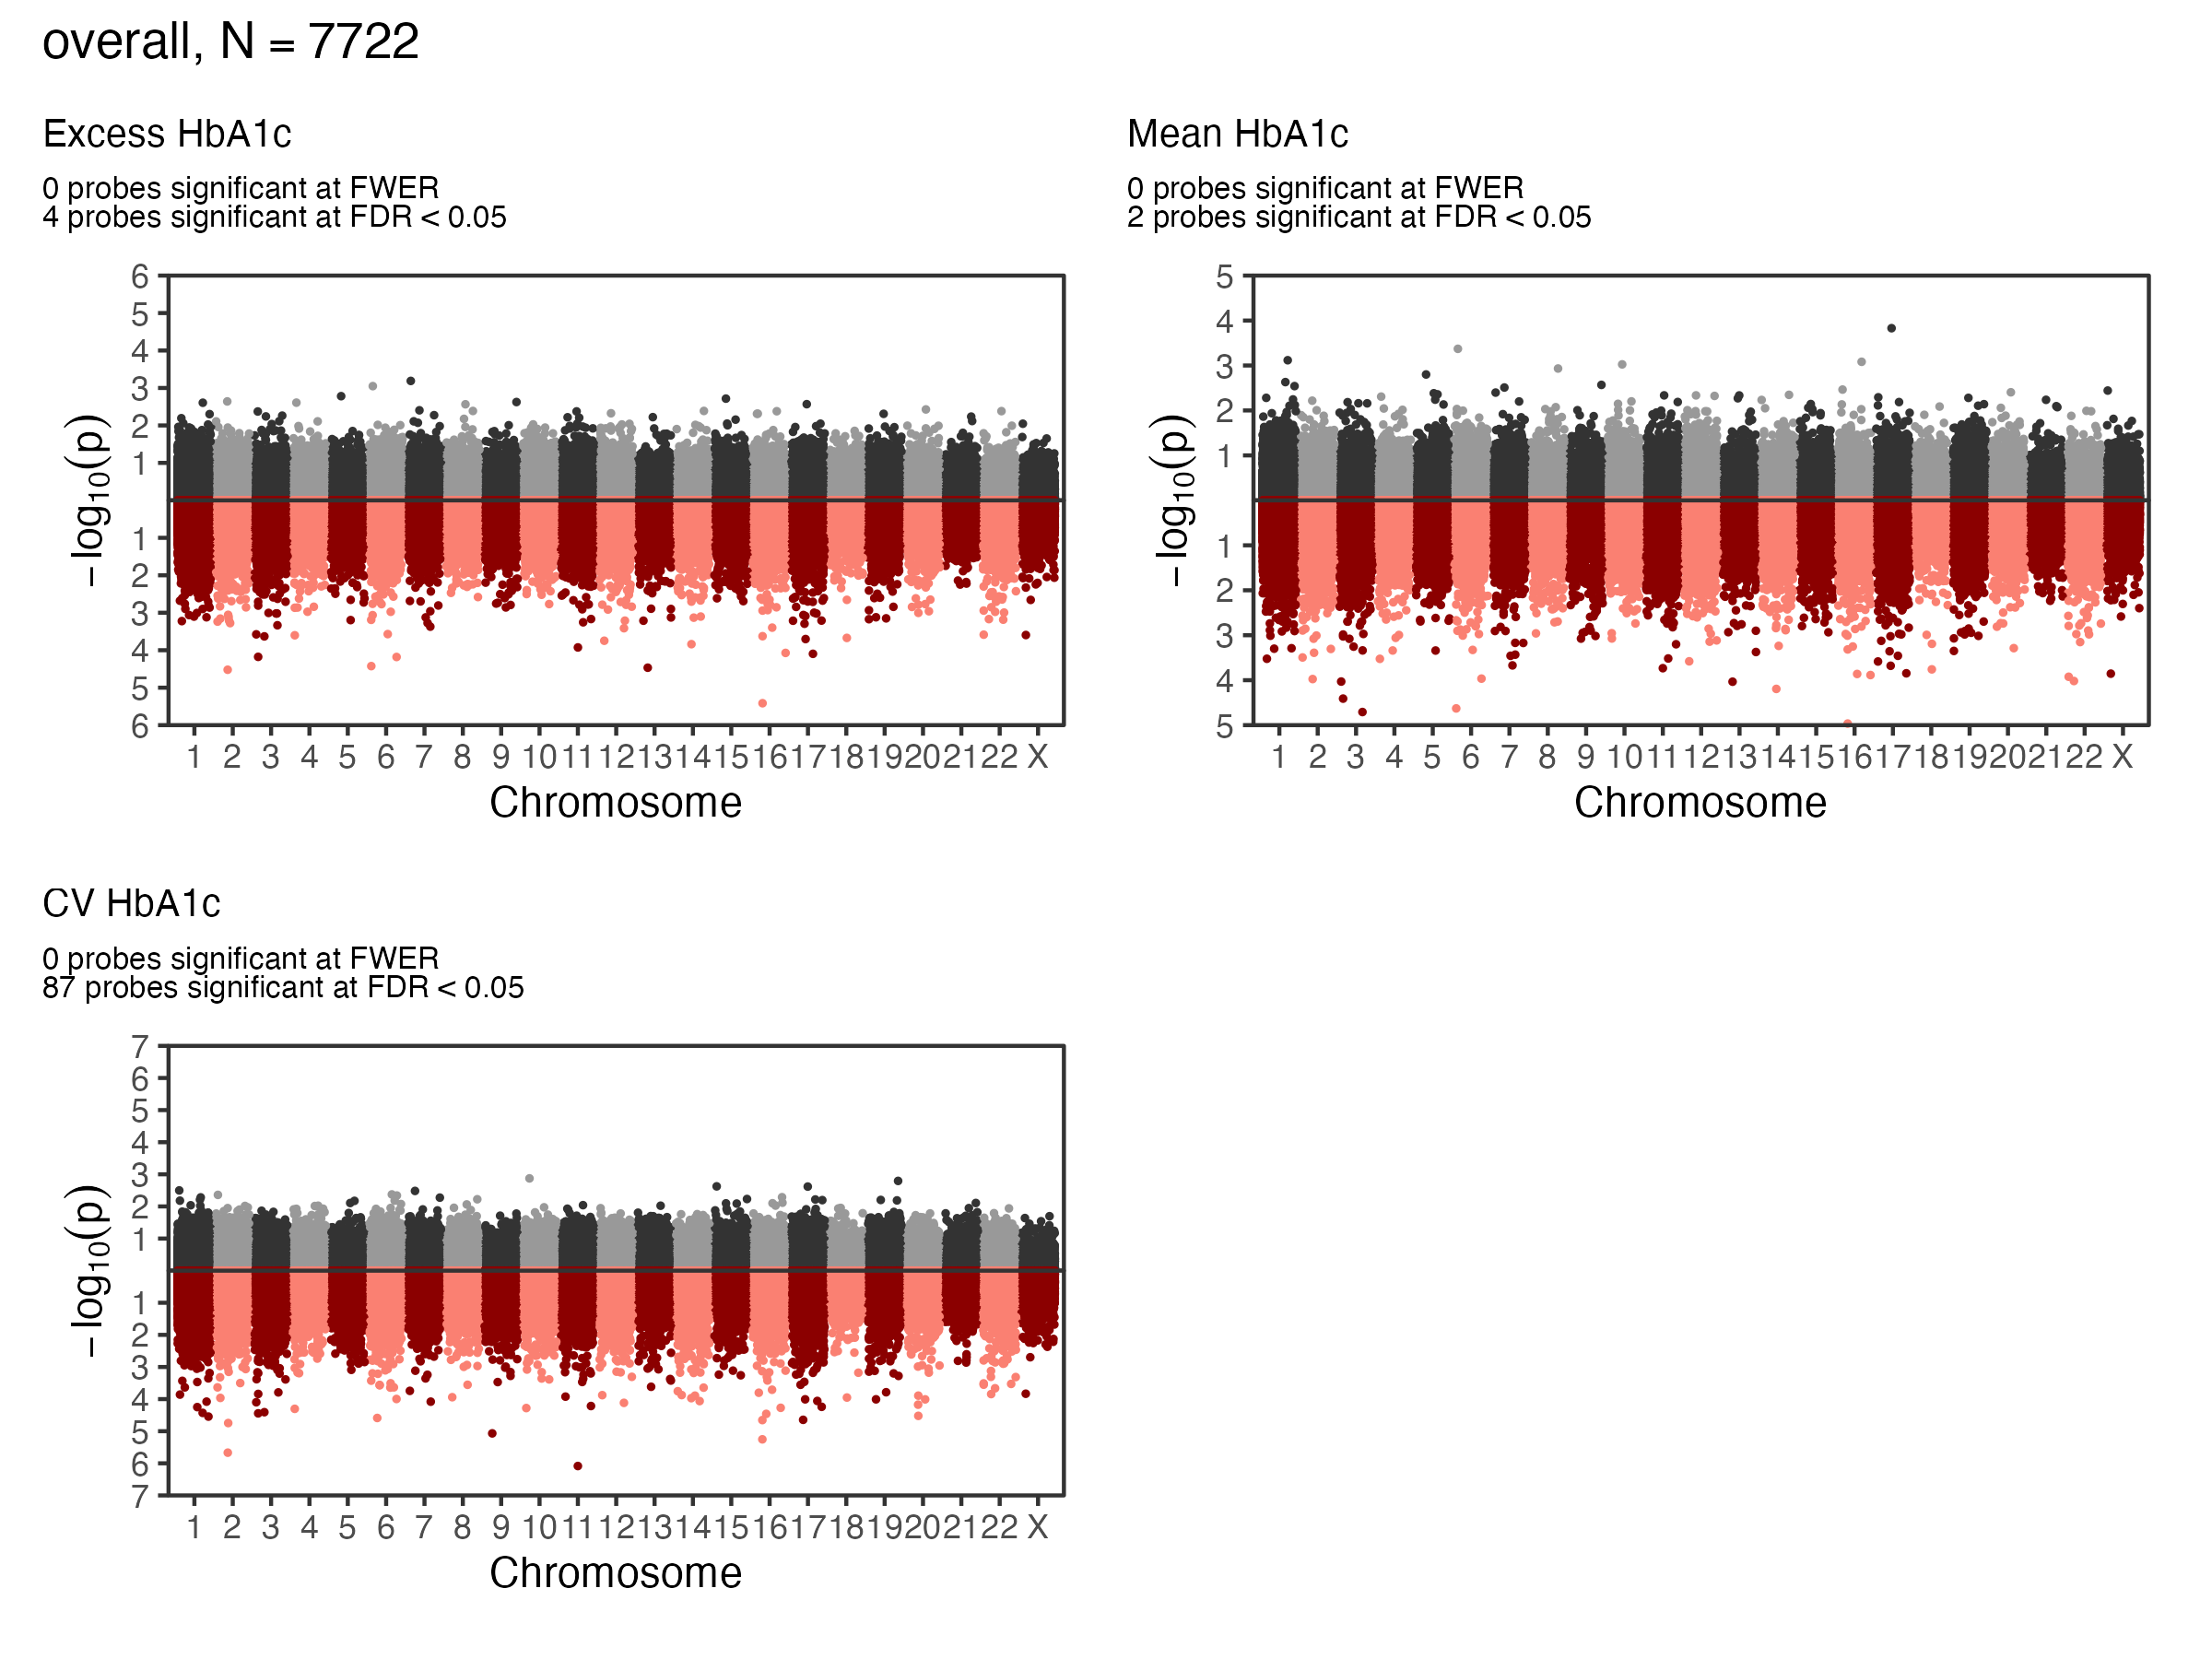
EWAS Results - A1c - Overall
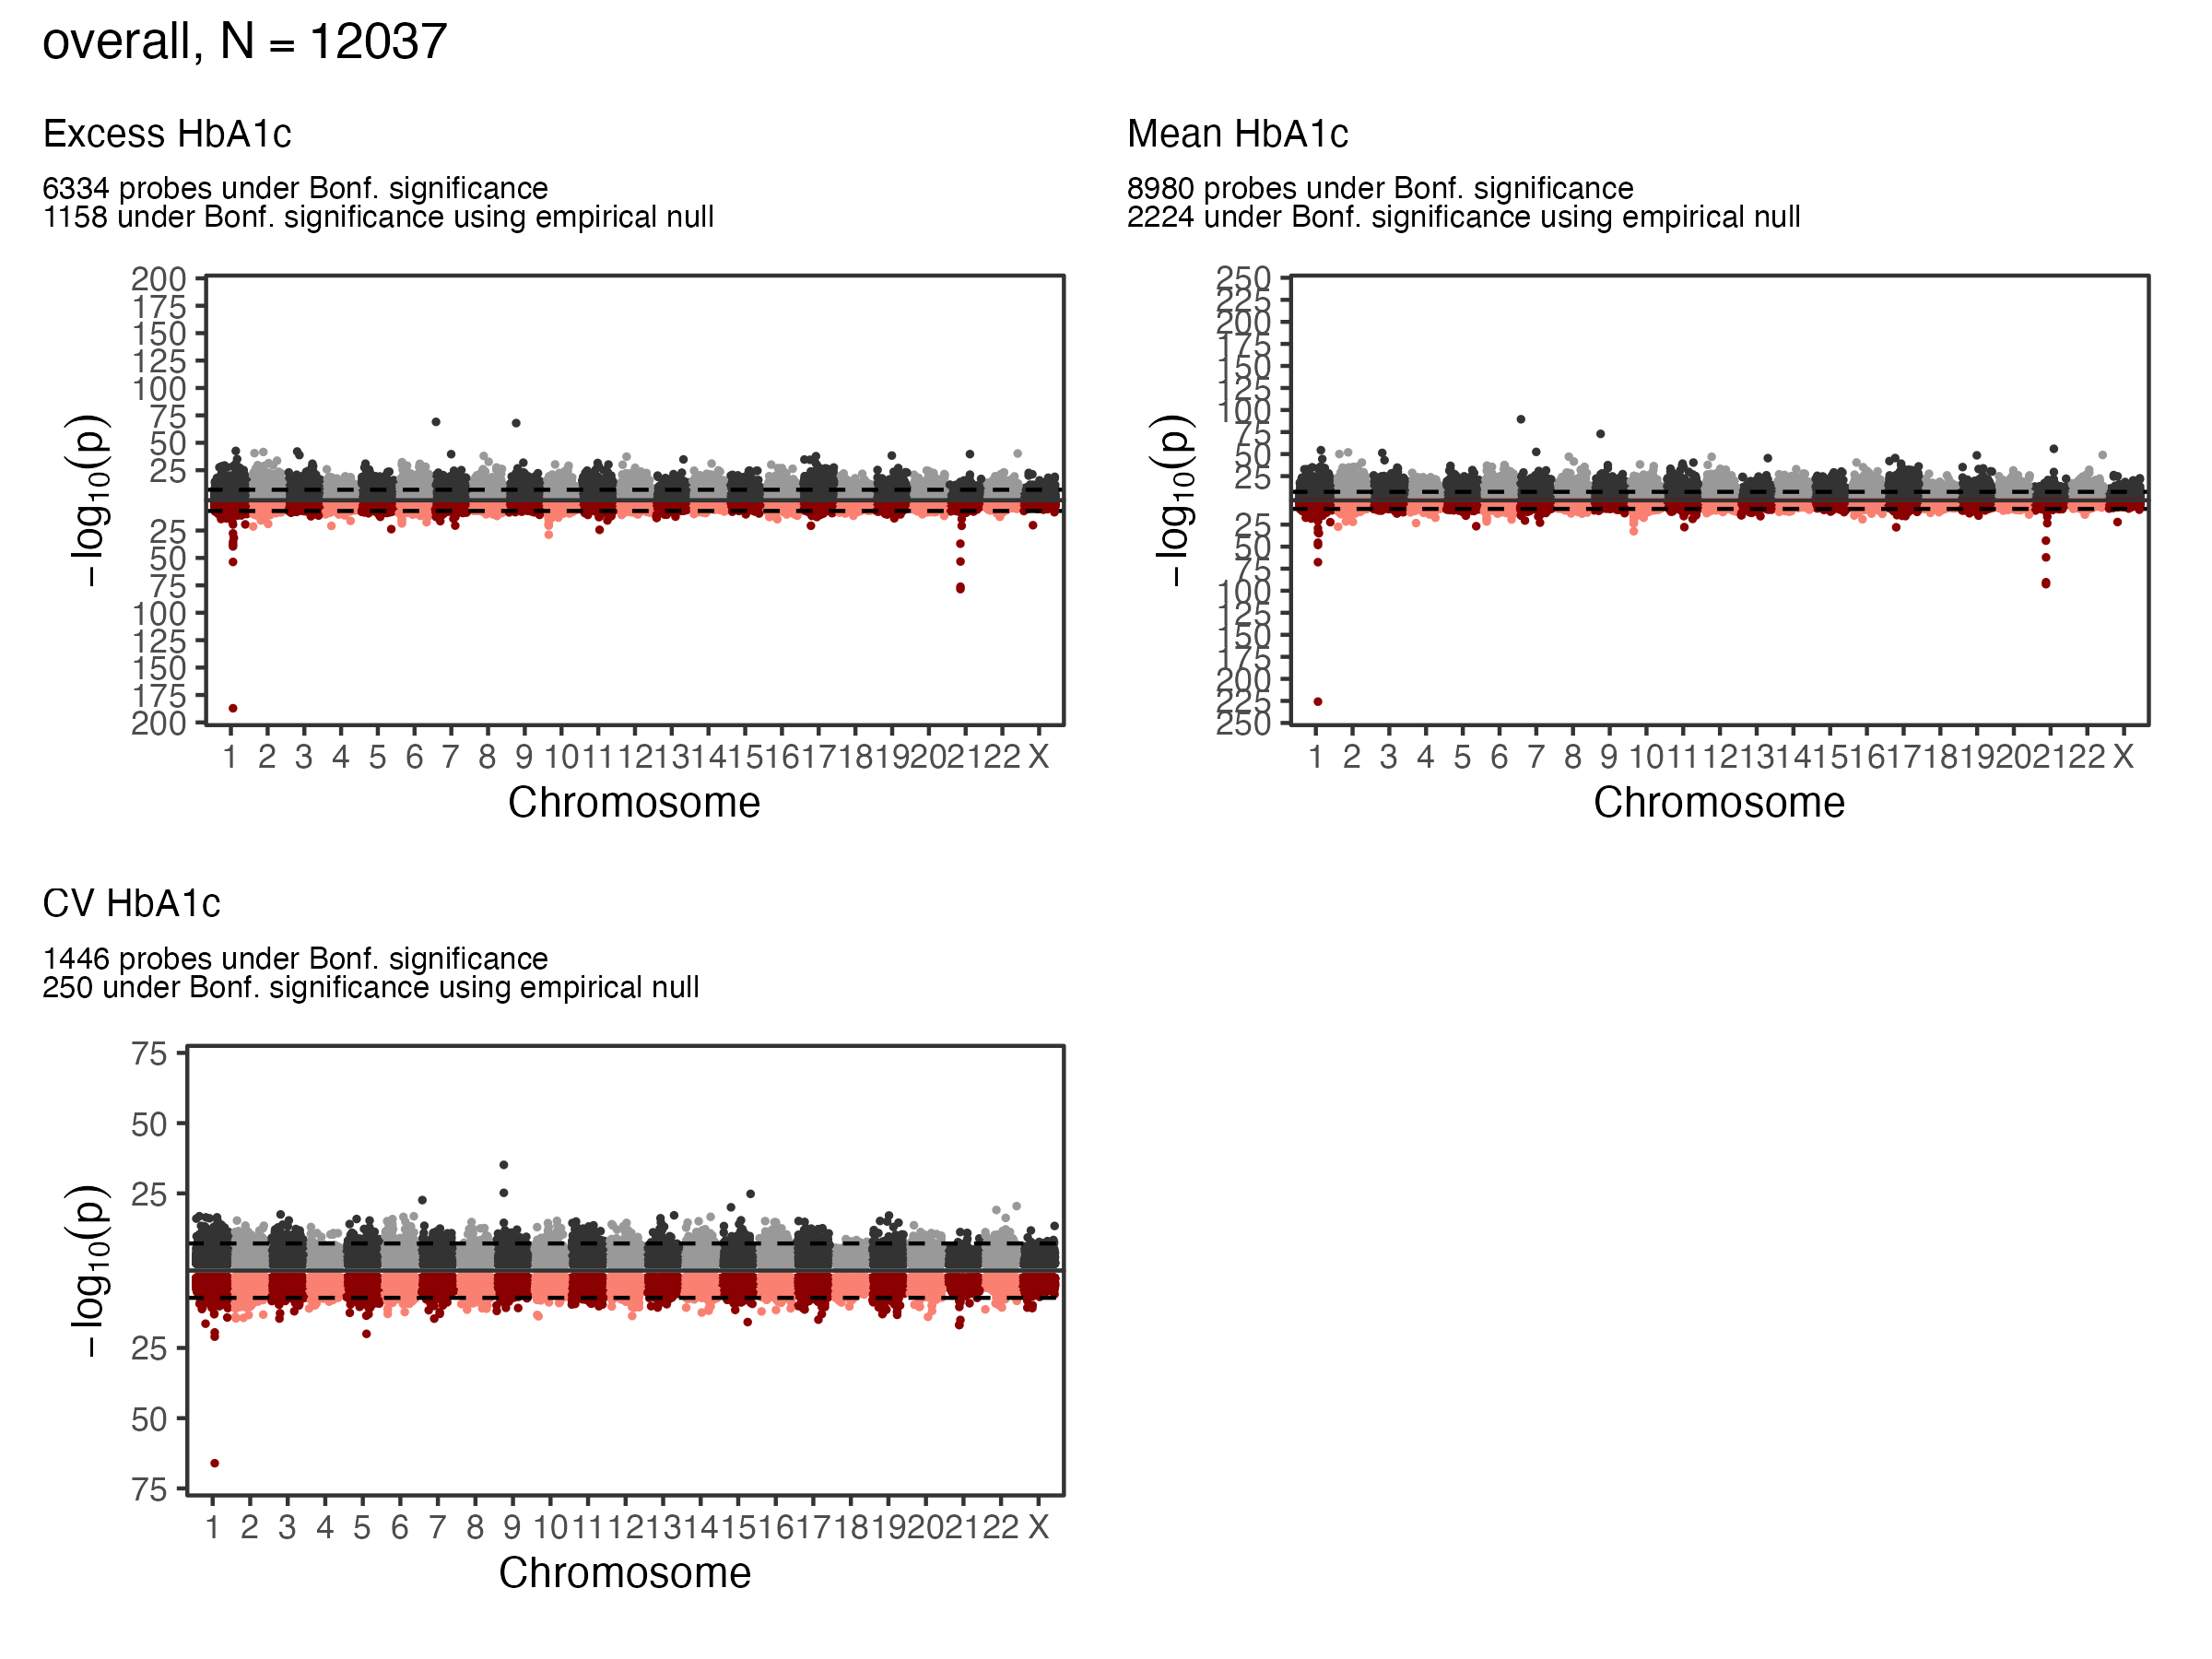
Overall Sample EWAS Manhattan Plot
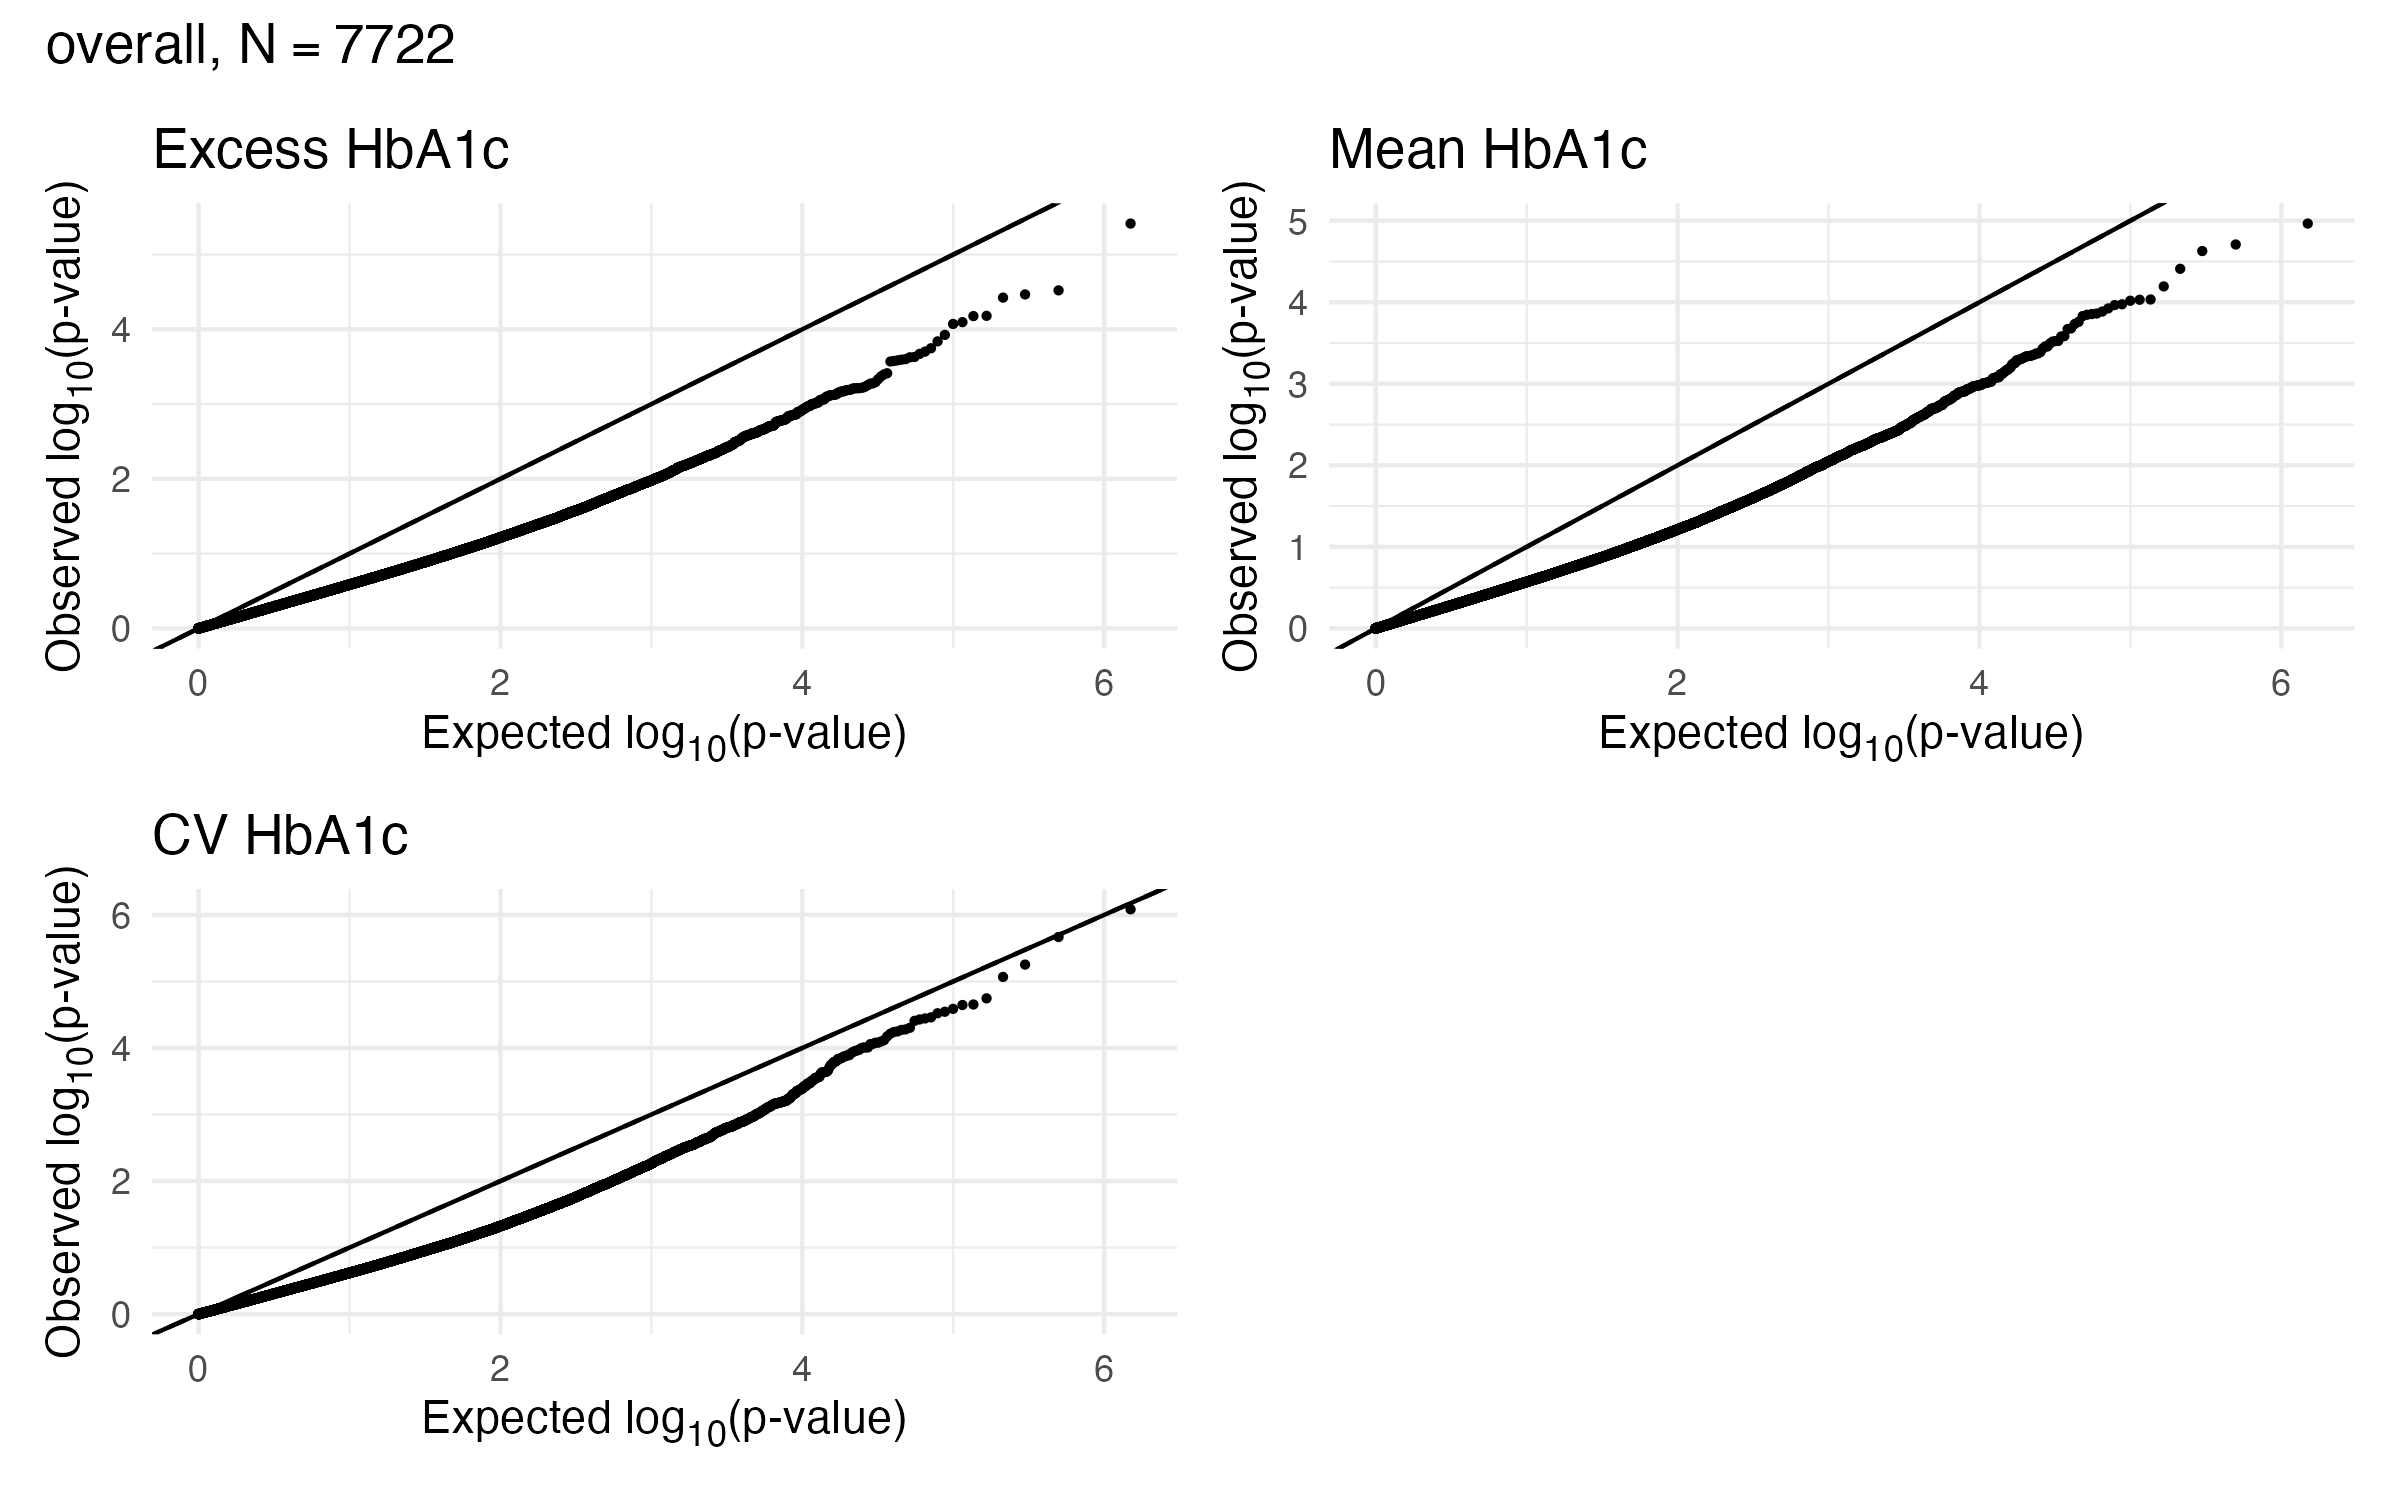
EWAS Results - A1c - Overall
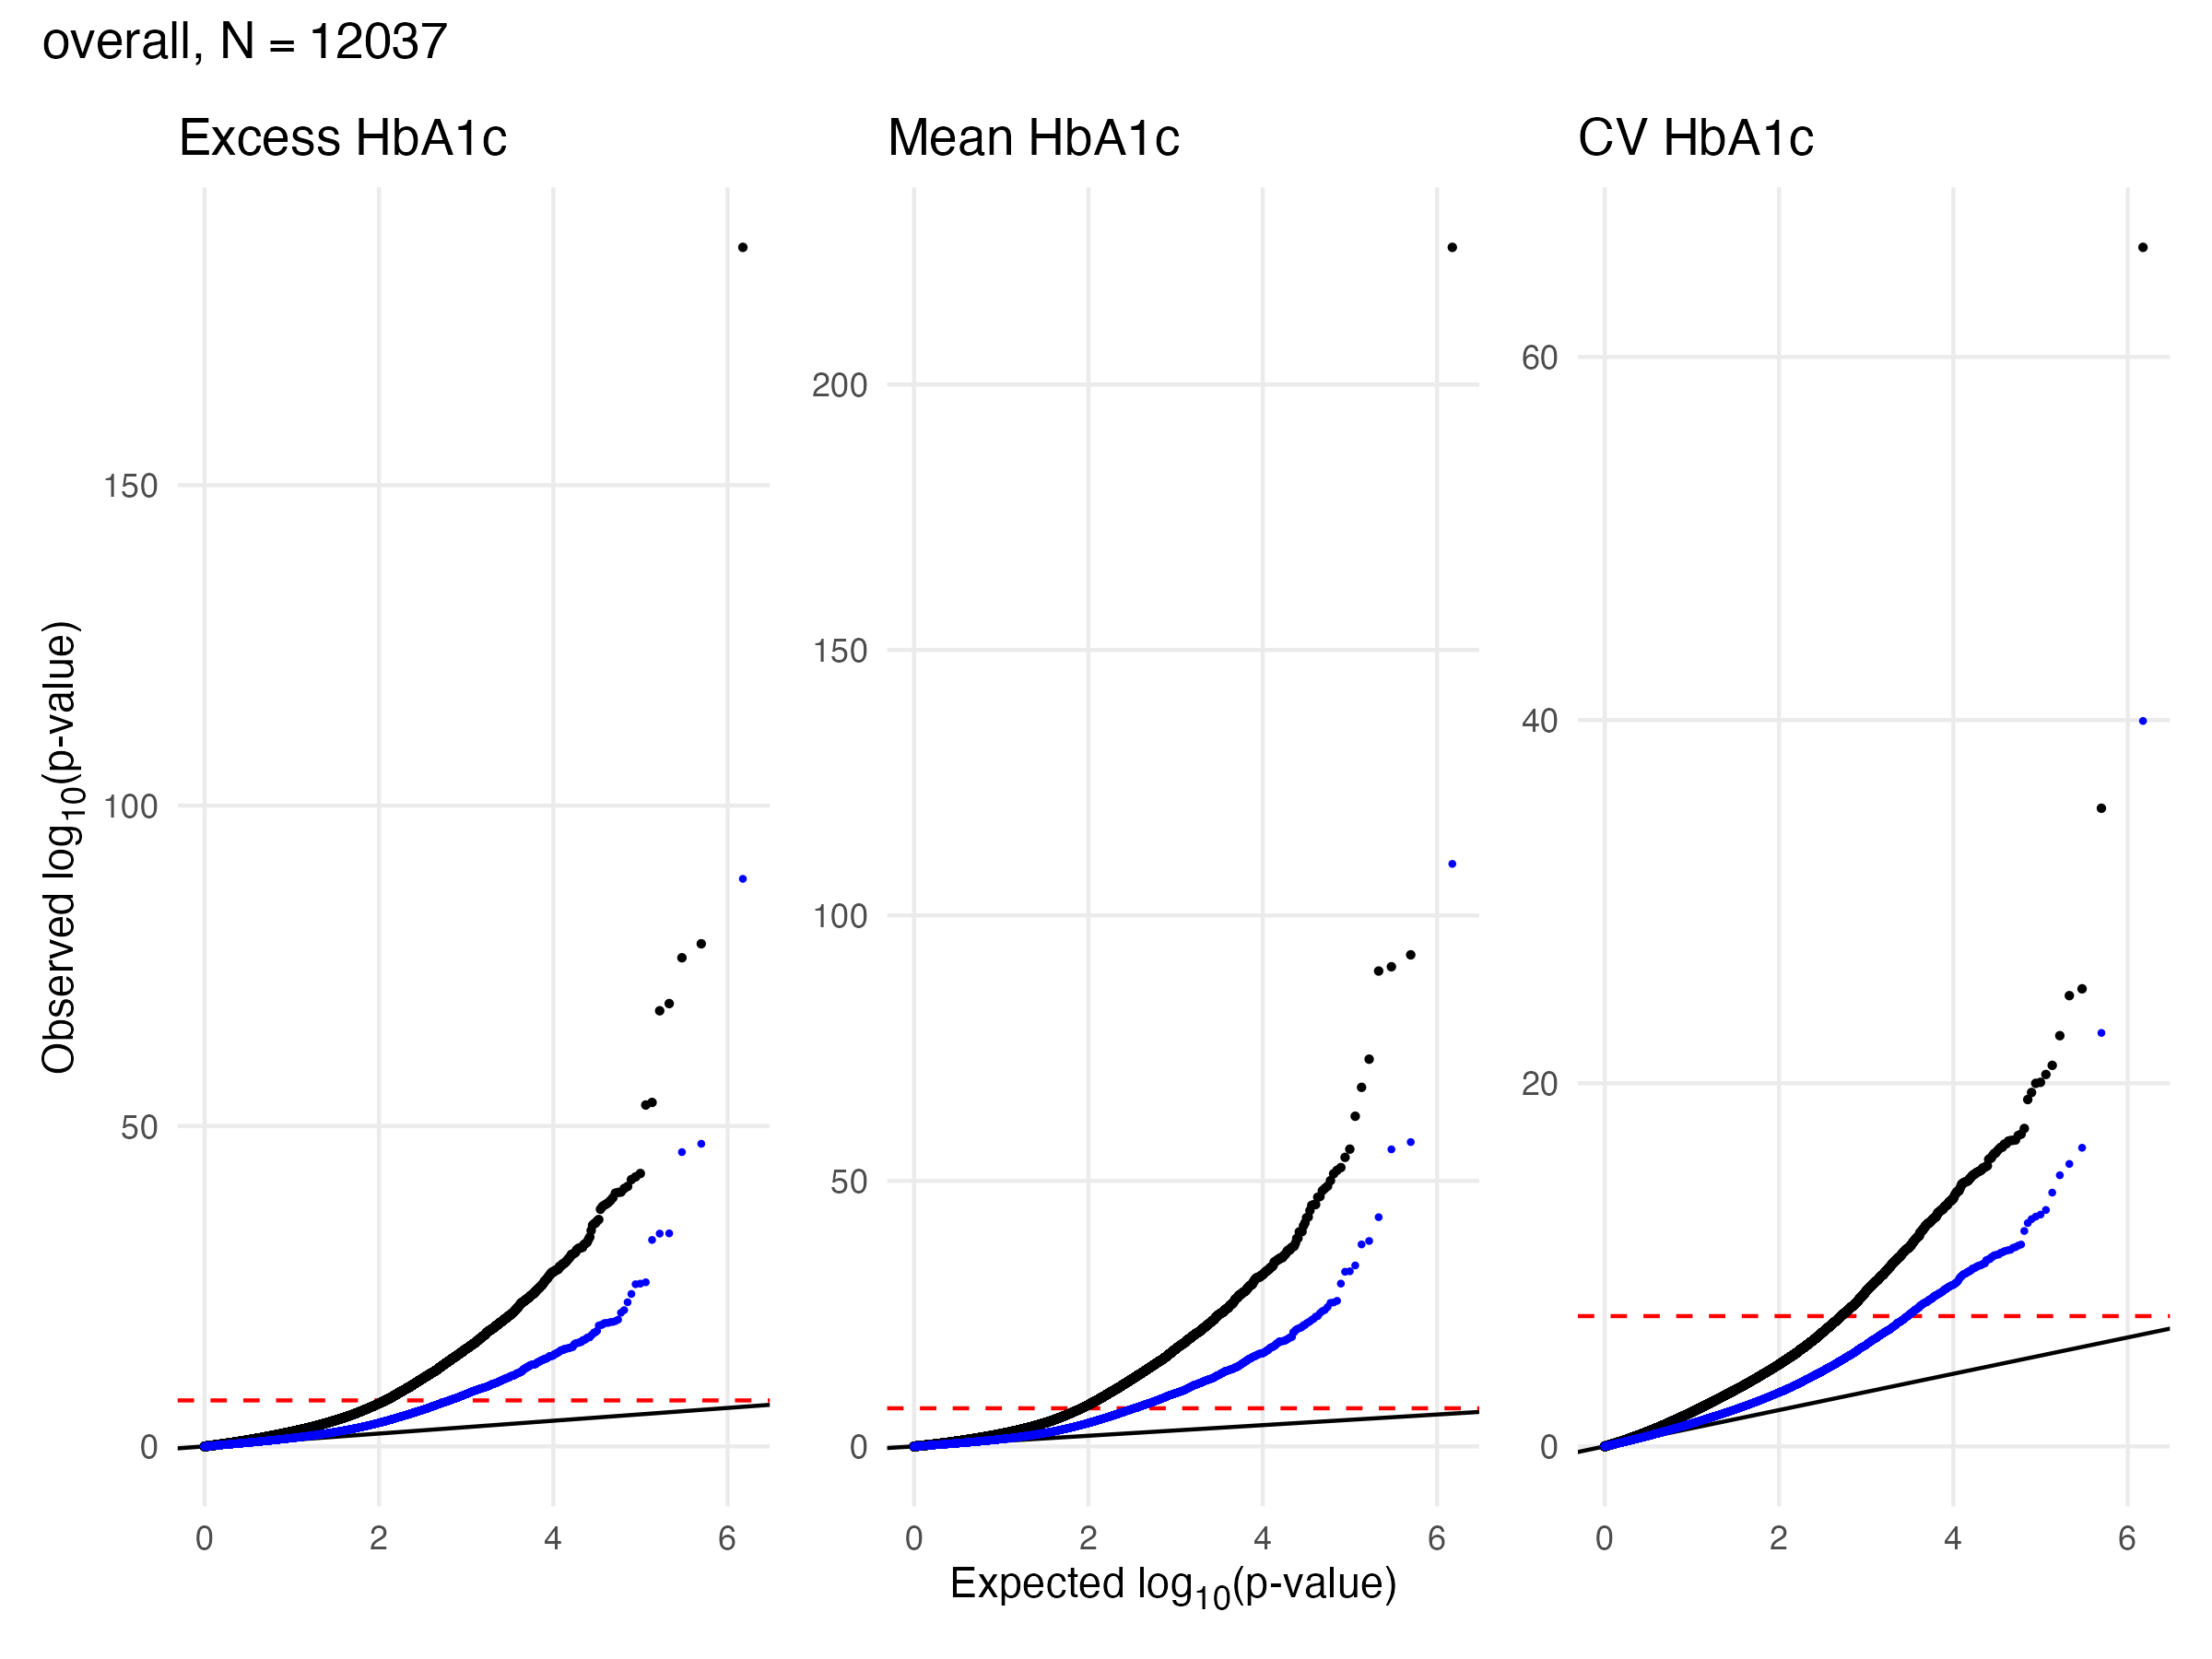
Overall Sample EWAS QQ Plot
EWAS Validation - A1c - Overall
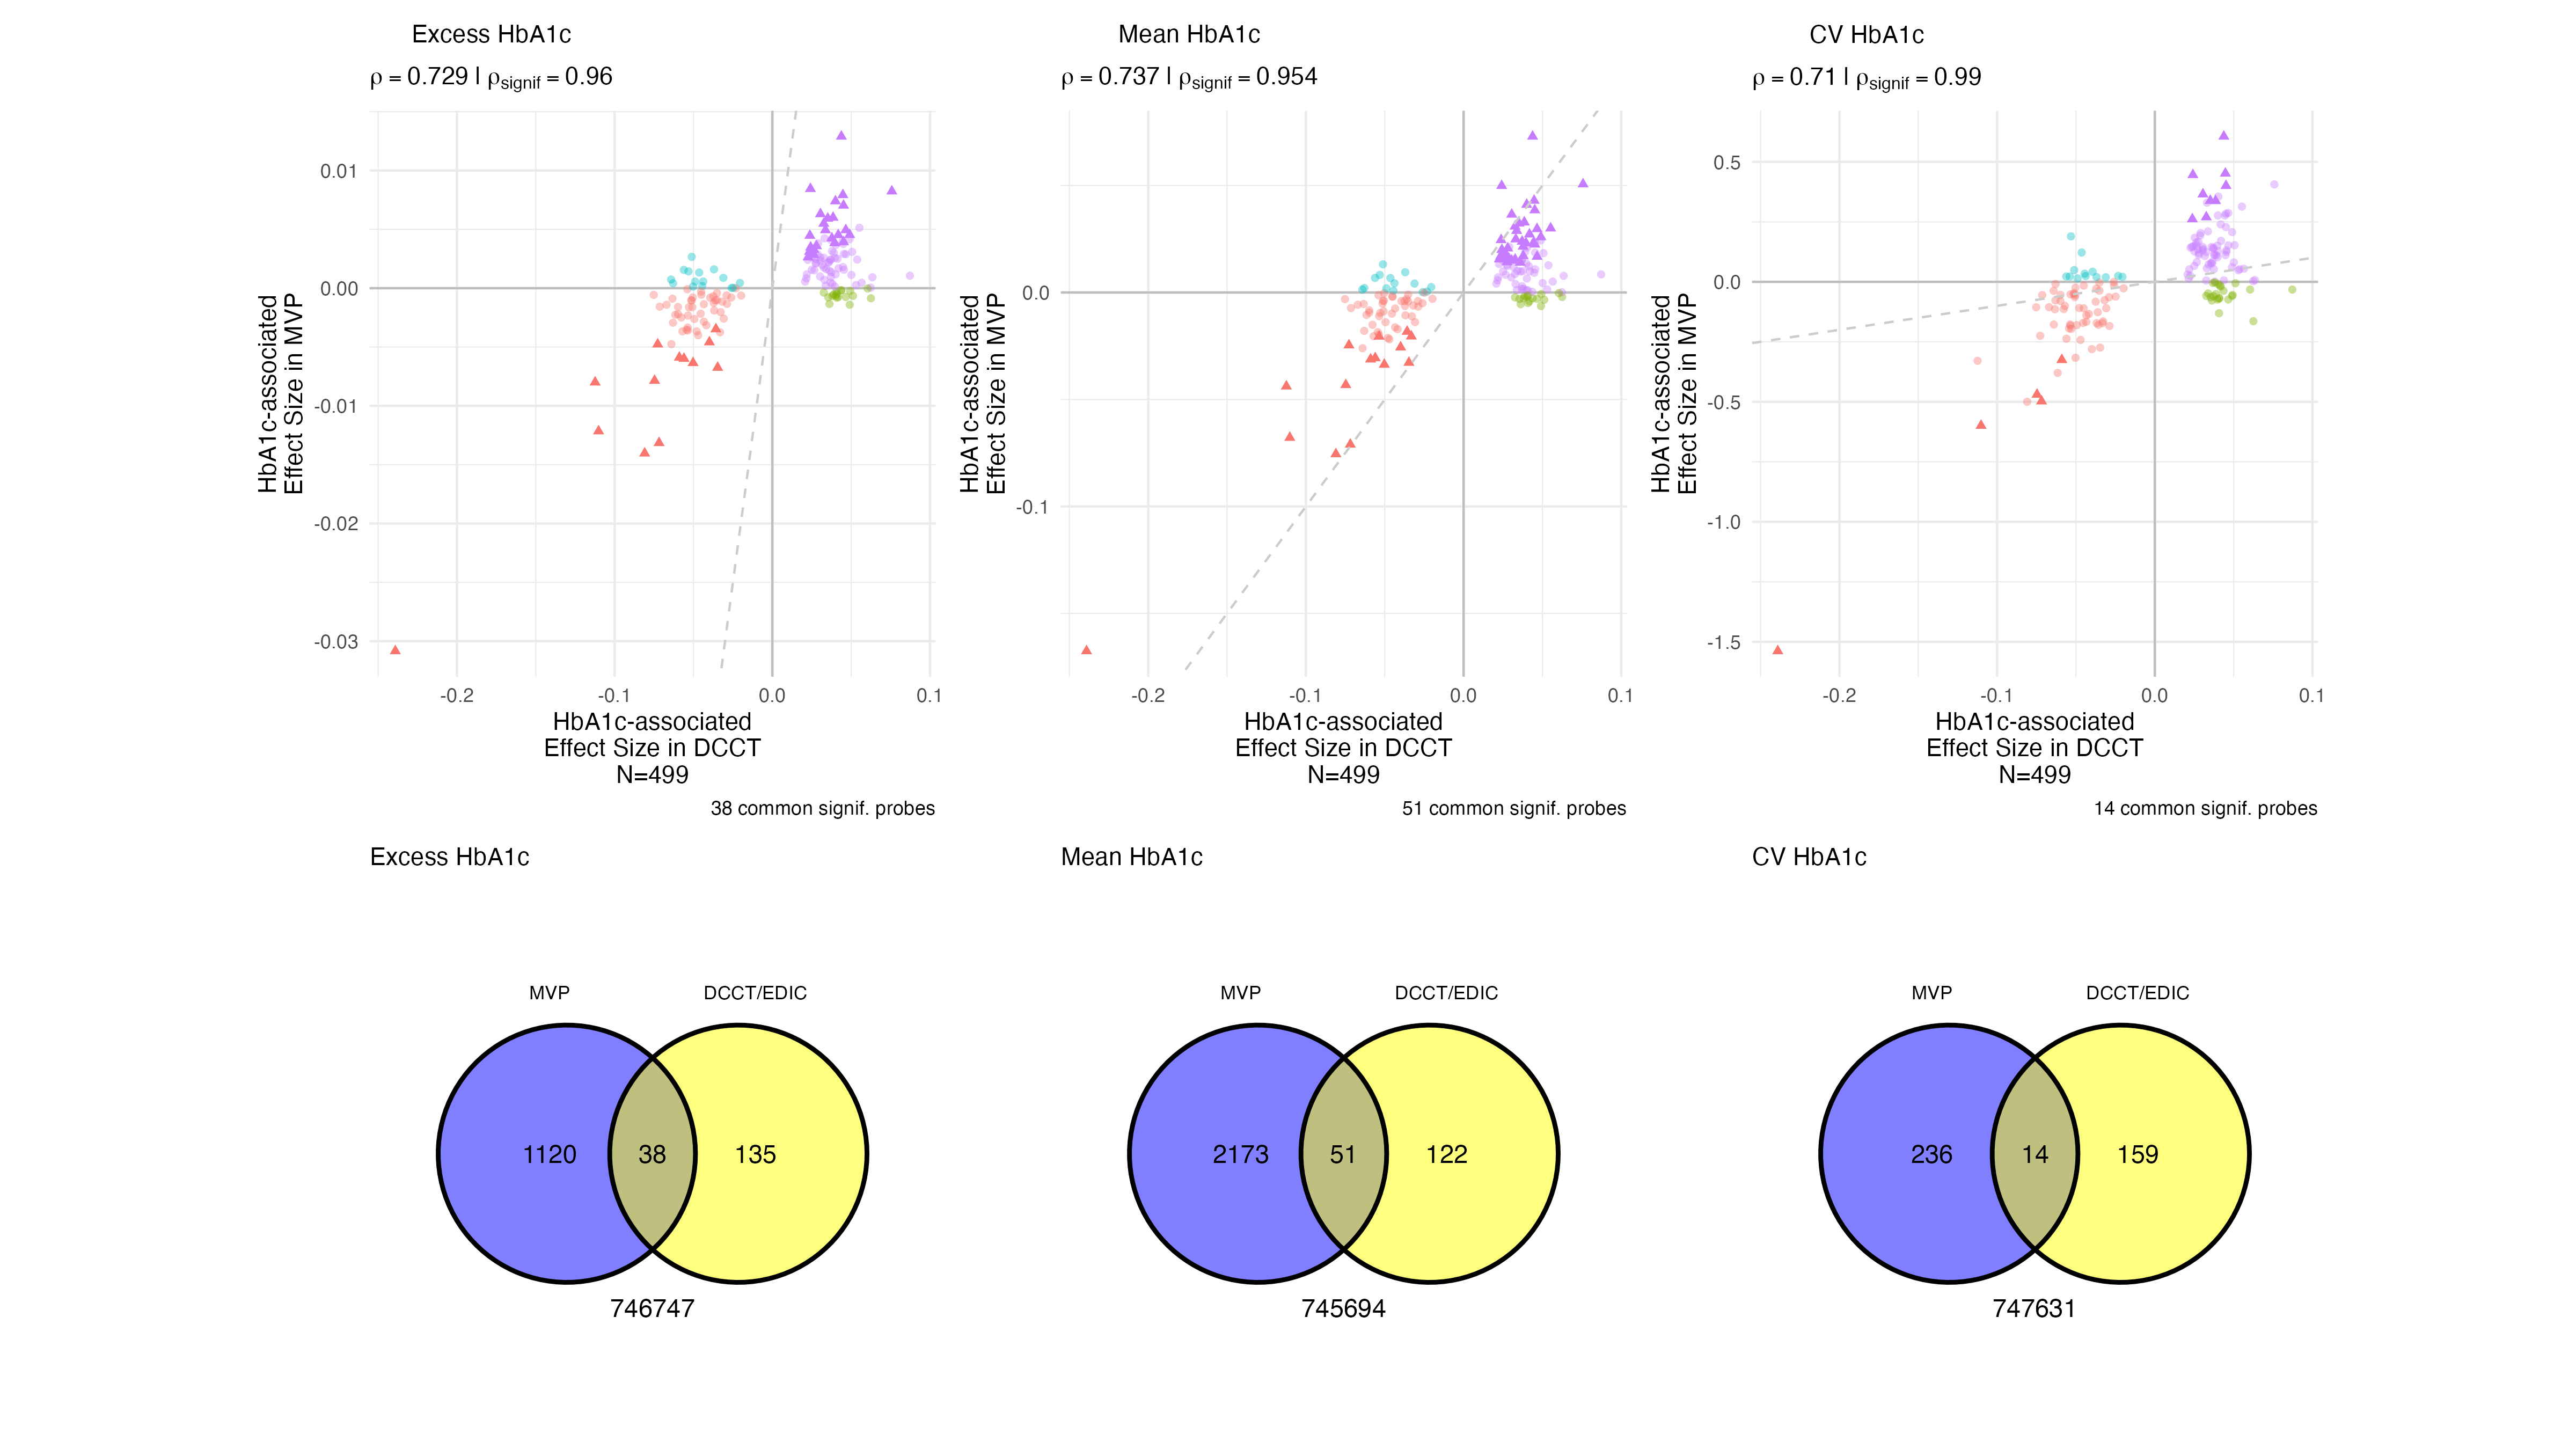
Comparisons to Chen 2020
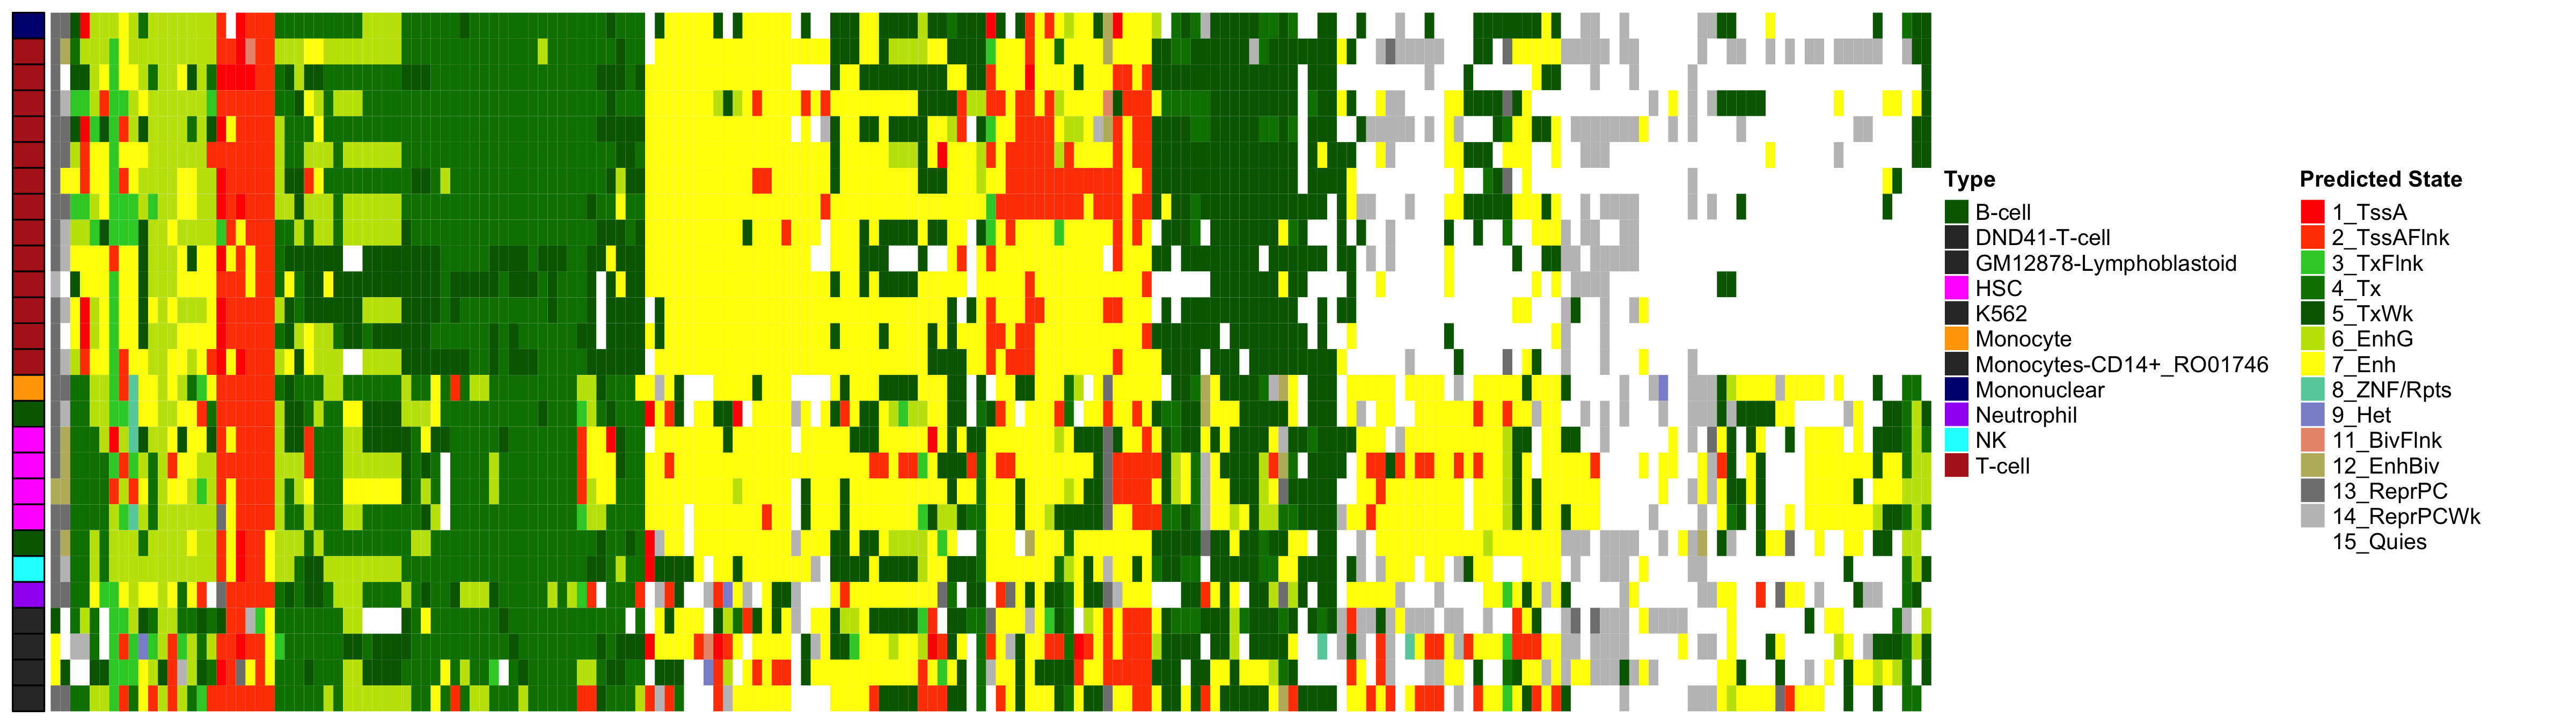
EWAS Functional Annotation - Excess HbA1c
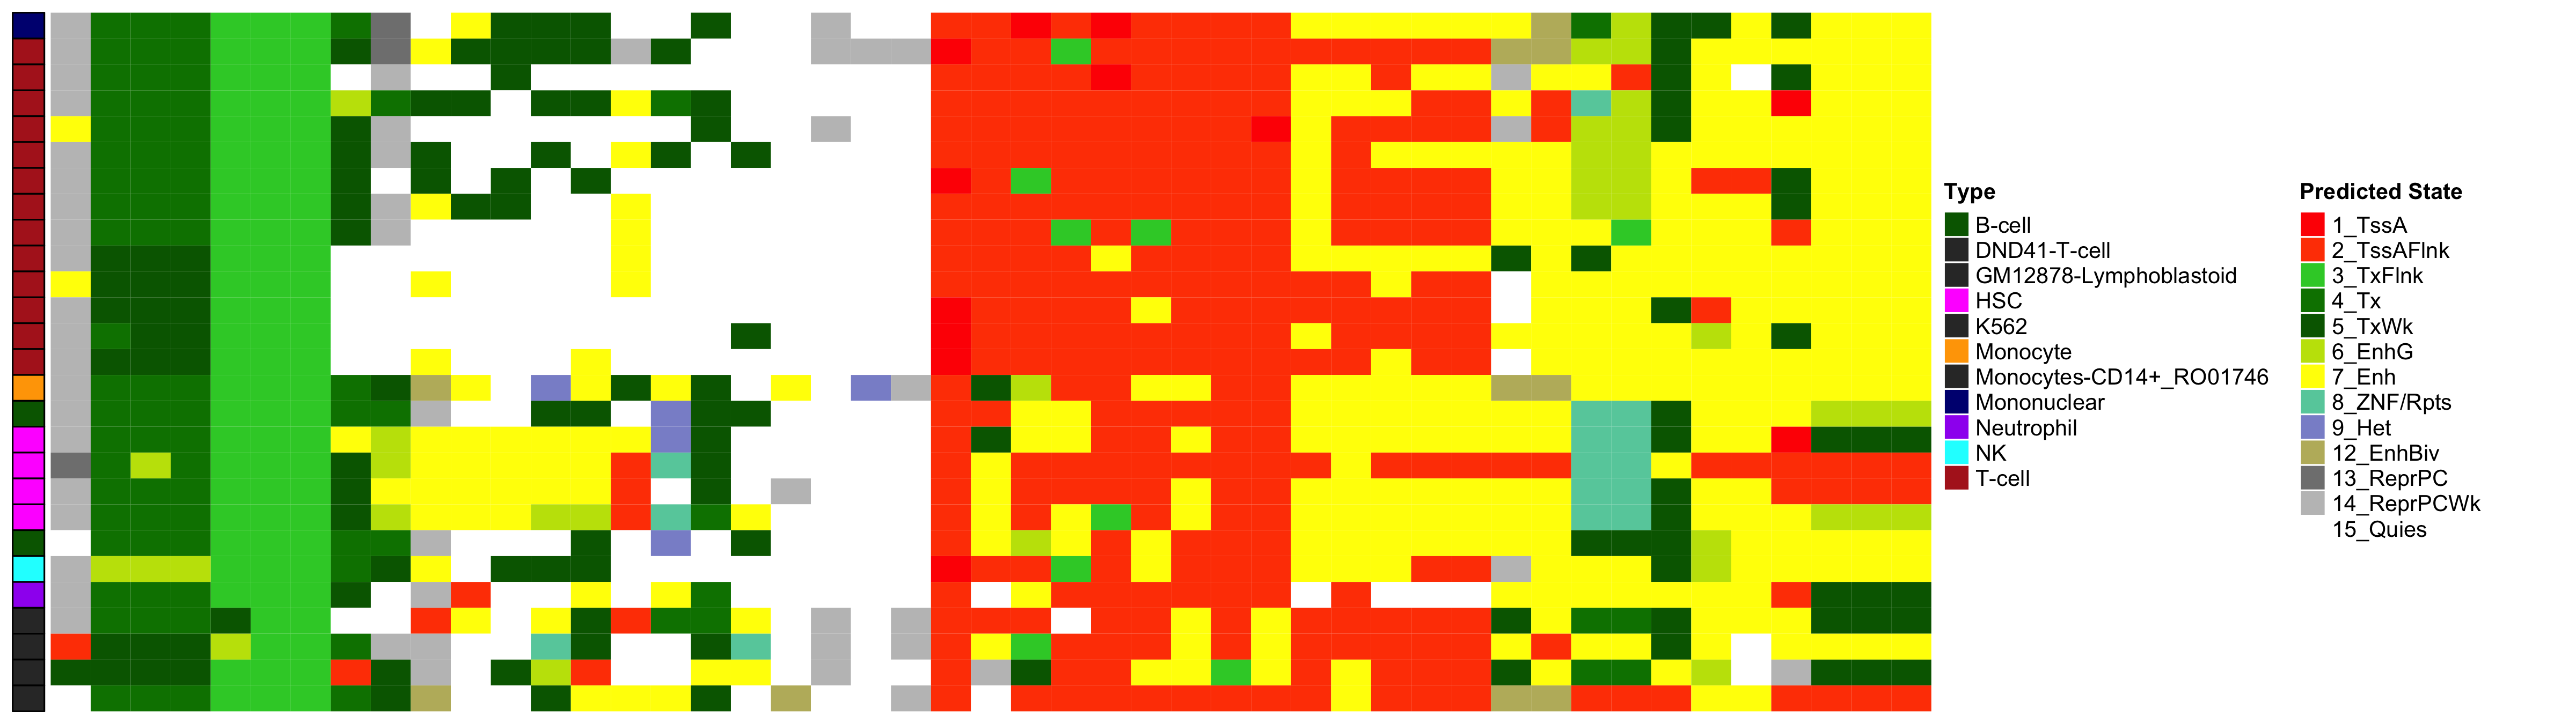
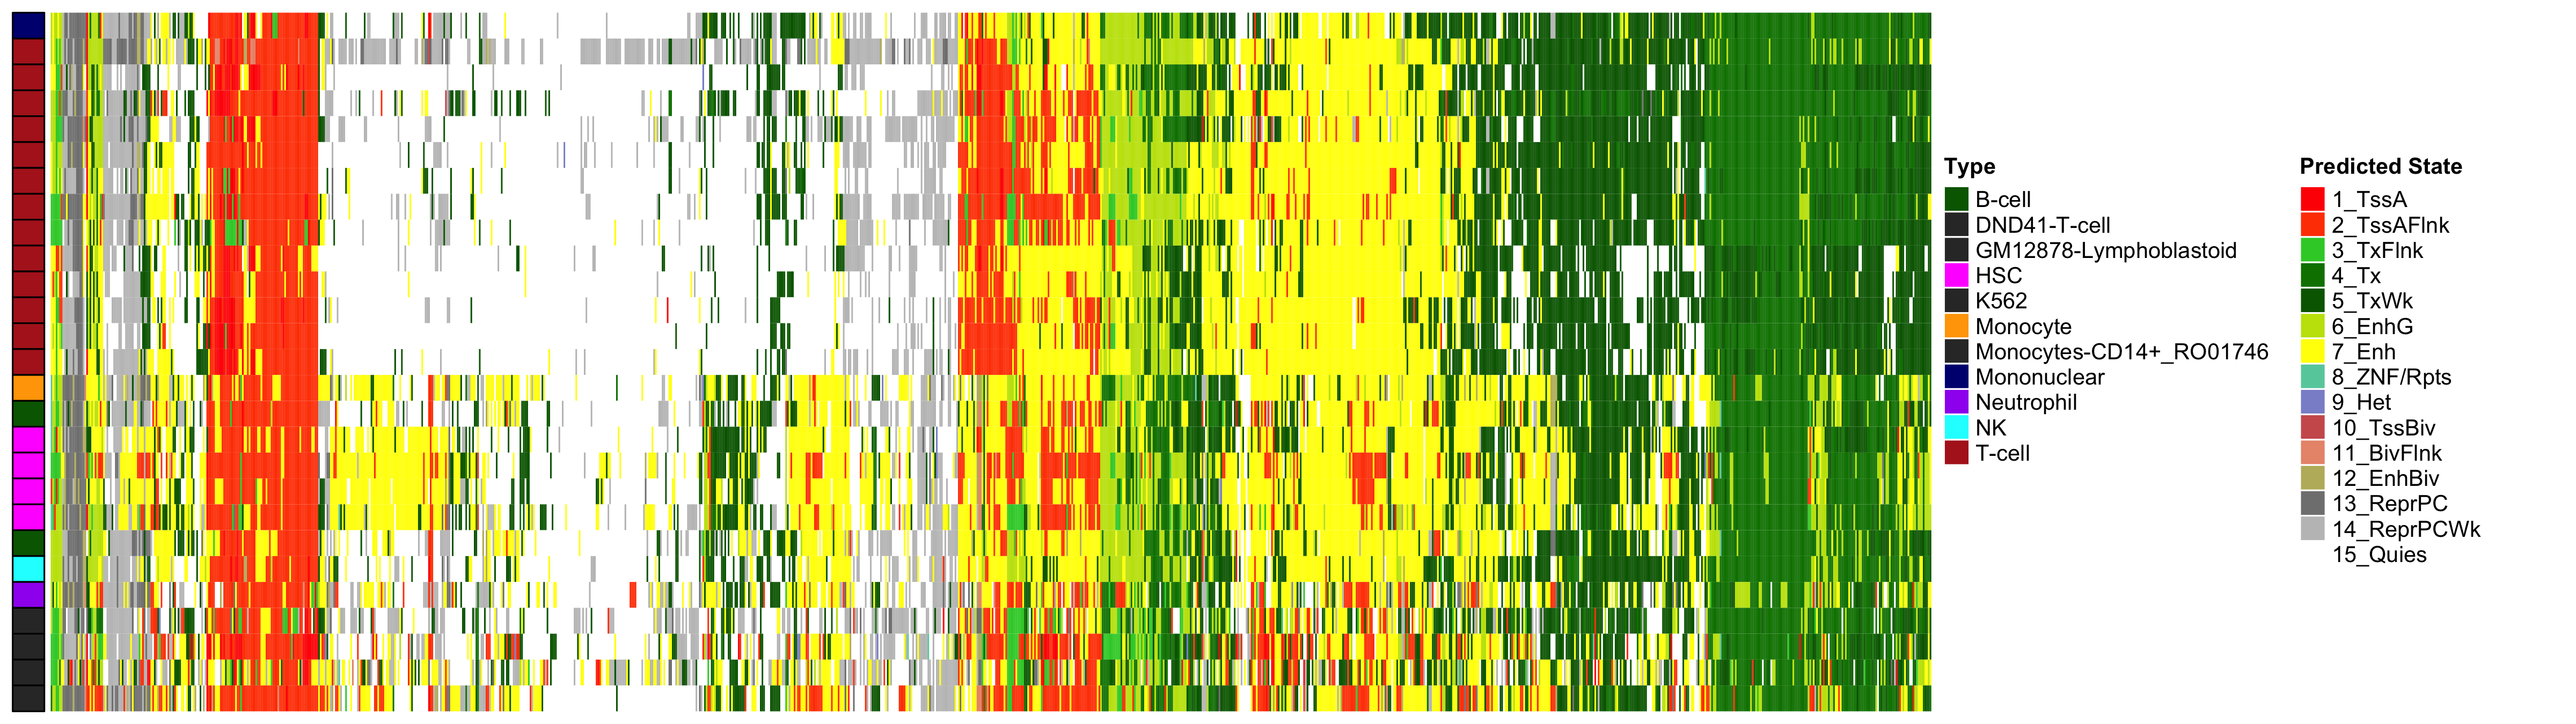 Heatmap of Chromatin States at CpGs associated with 5 Year Excess HbA1c
EWAS Functional Annotation - Mean HbA1c
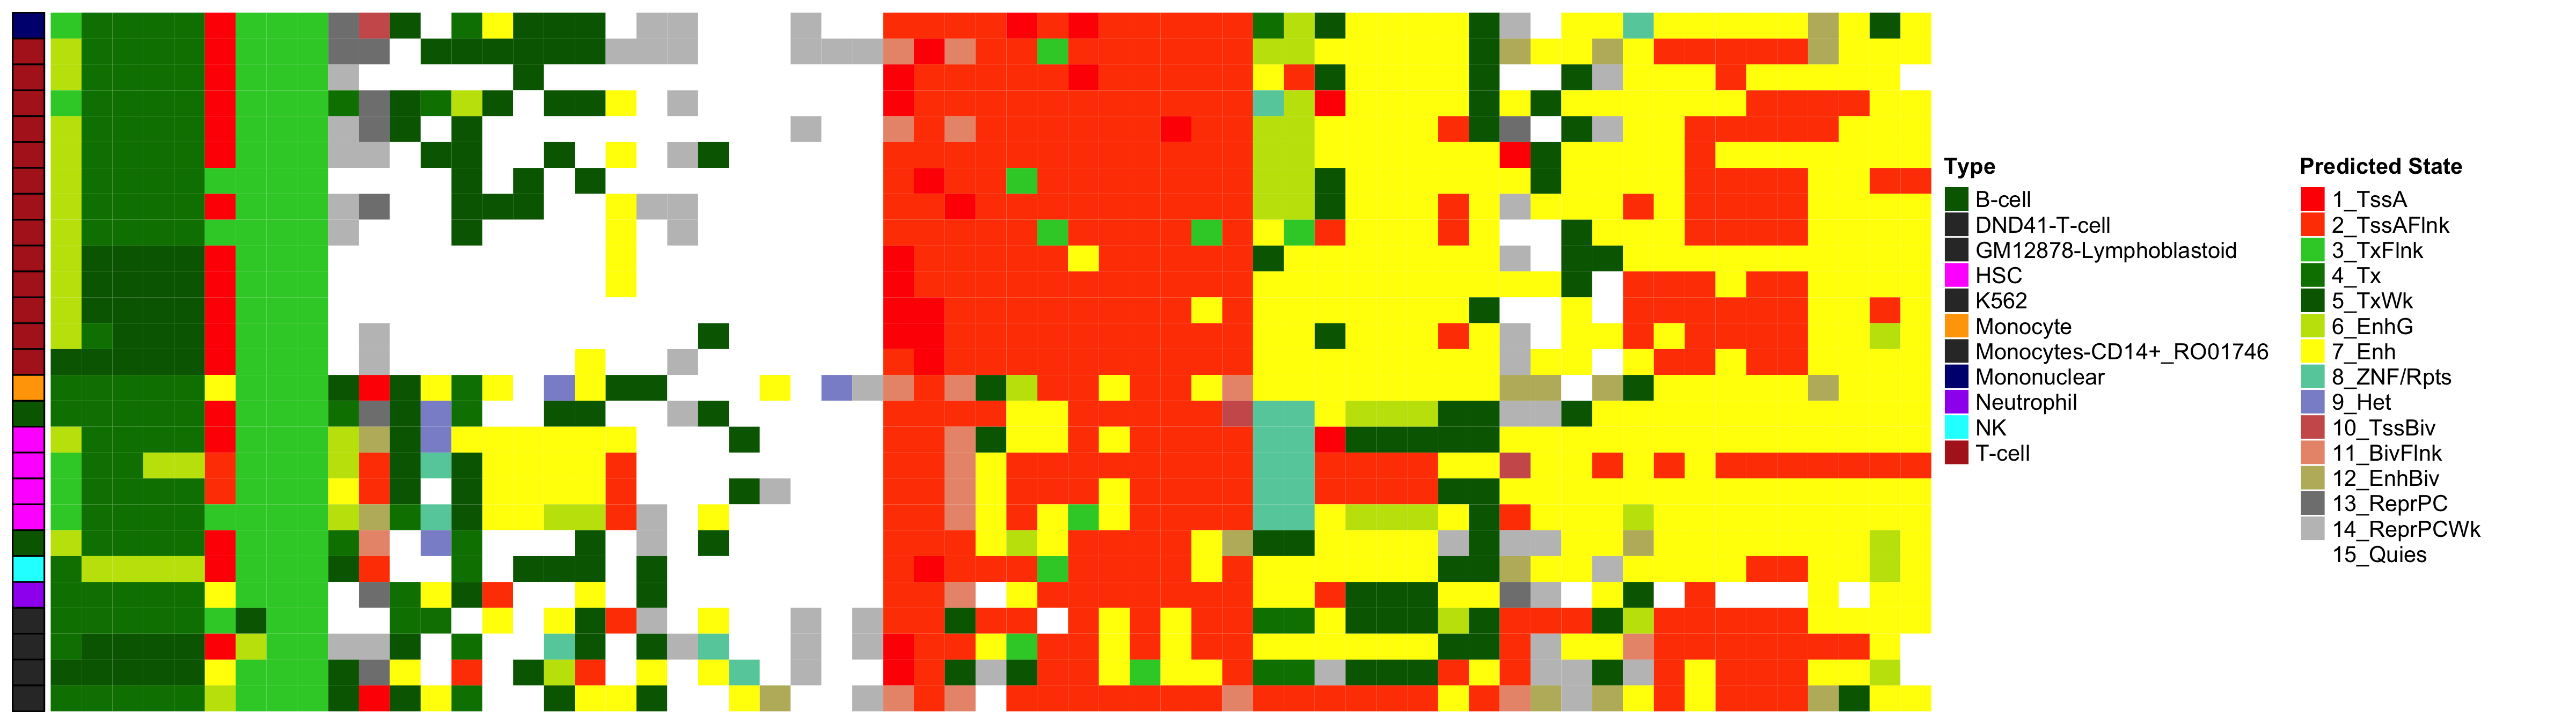
 Heatmap of Chromatin States at CpGs associated with 5 Year Excess HbA1c
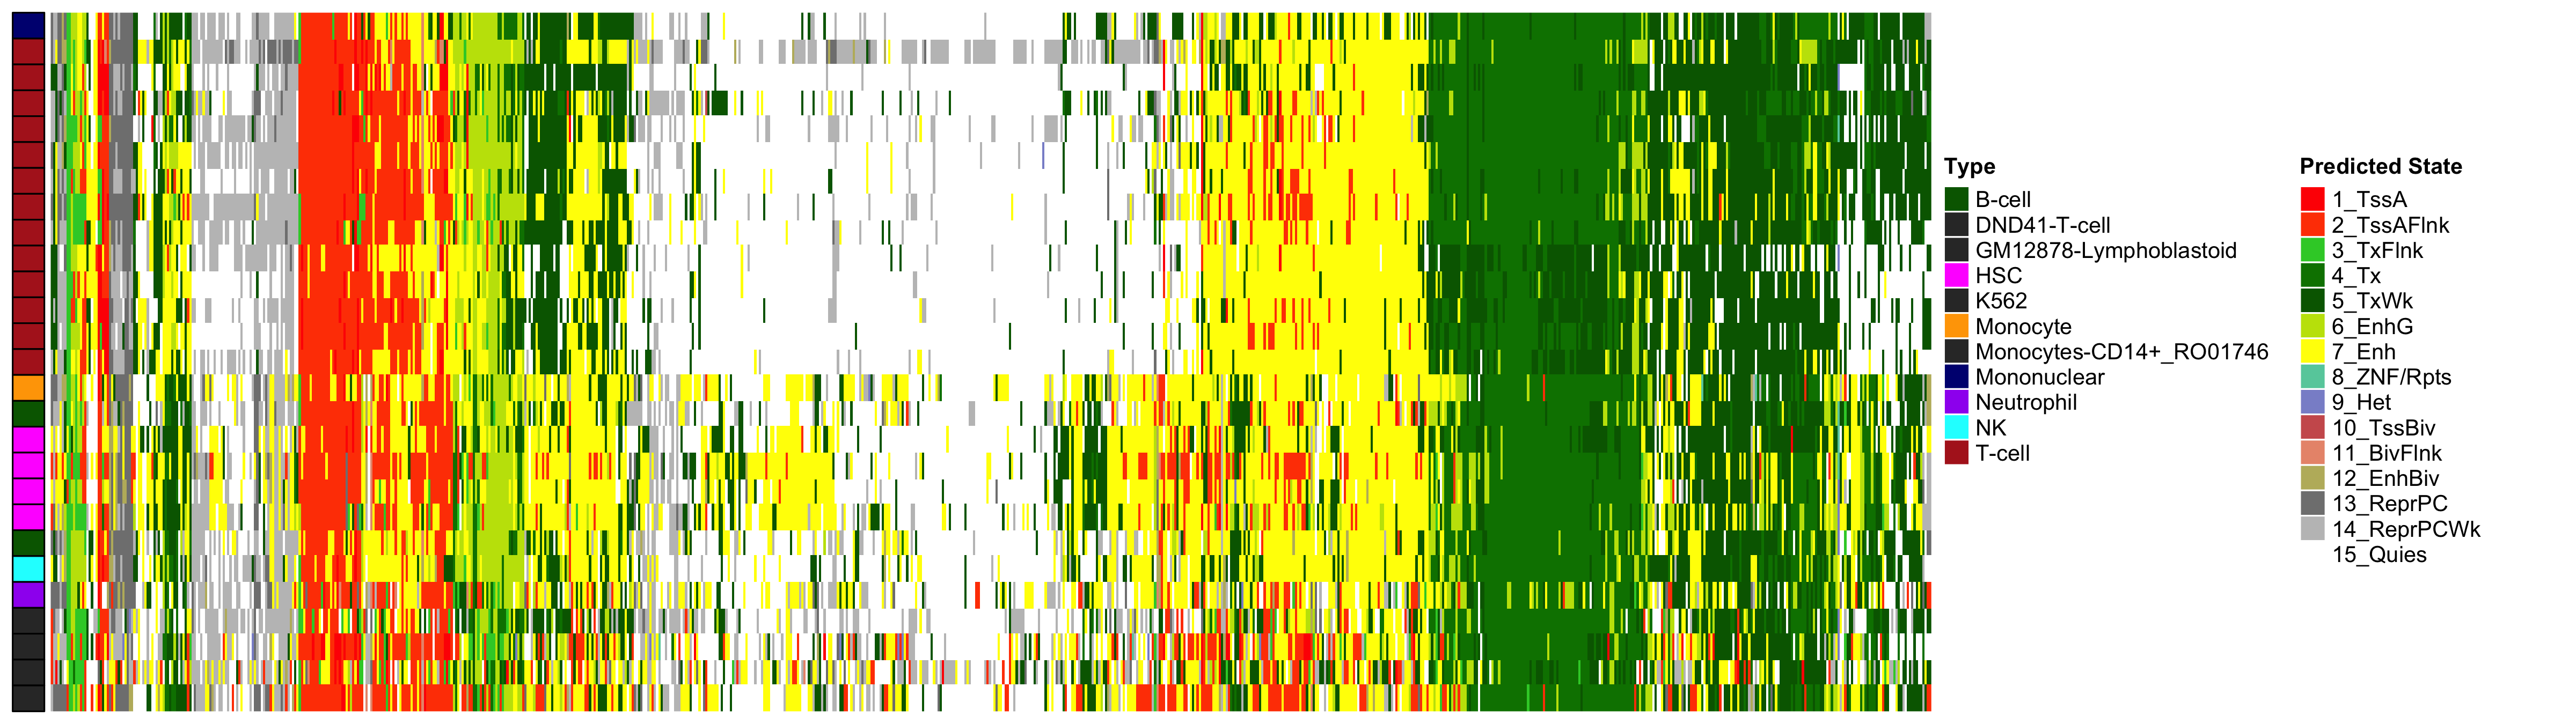
EWAS Functional Annotation - CV HbA1c
 Heatmap of Chromatin States at CpGs associated with 5 Year Excess HbA1c
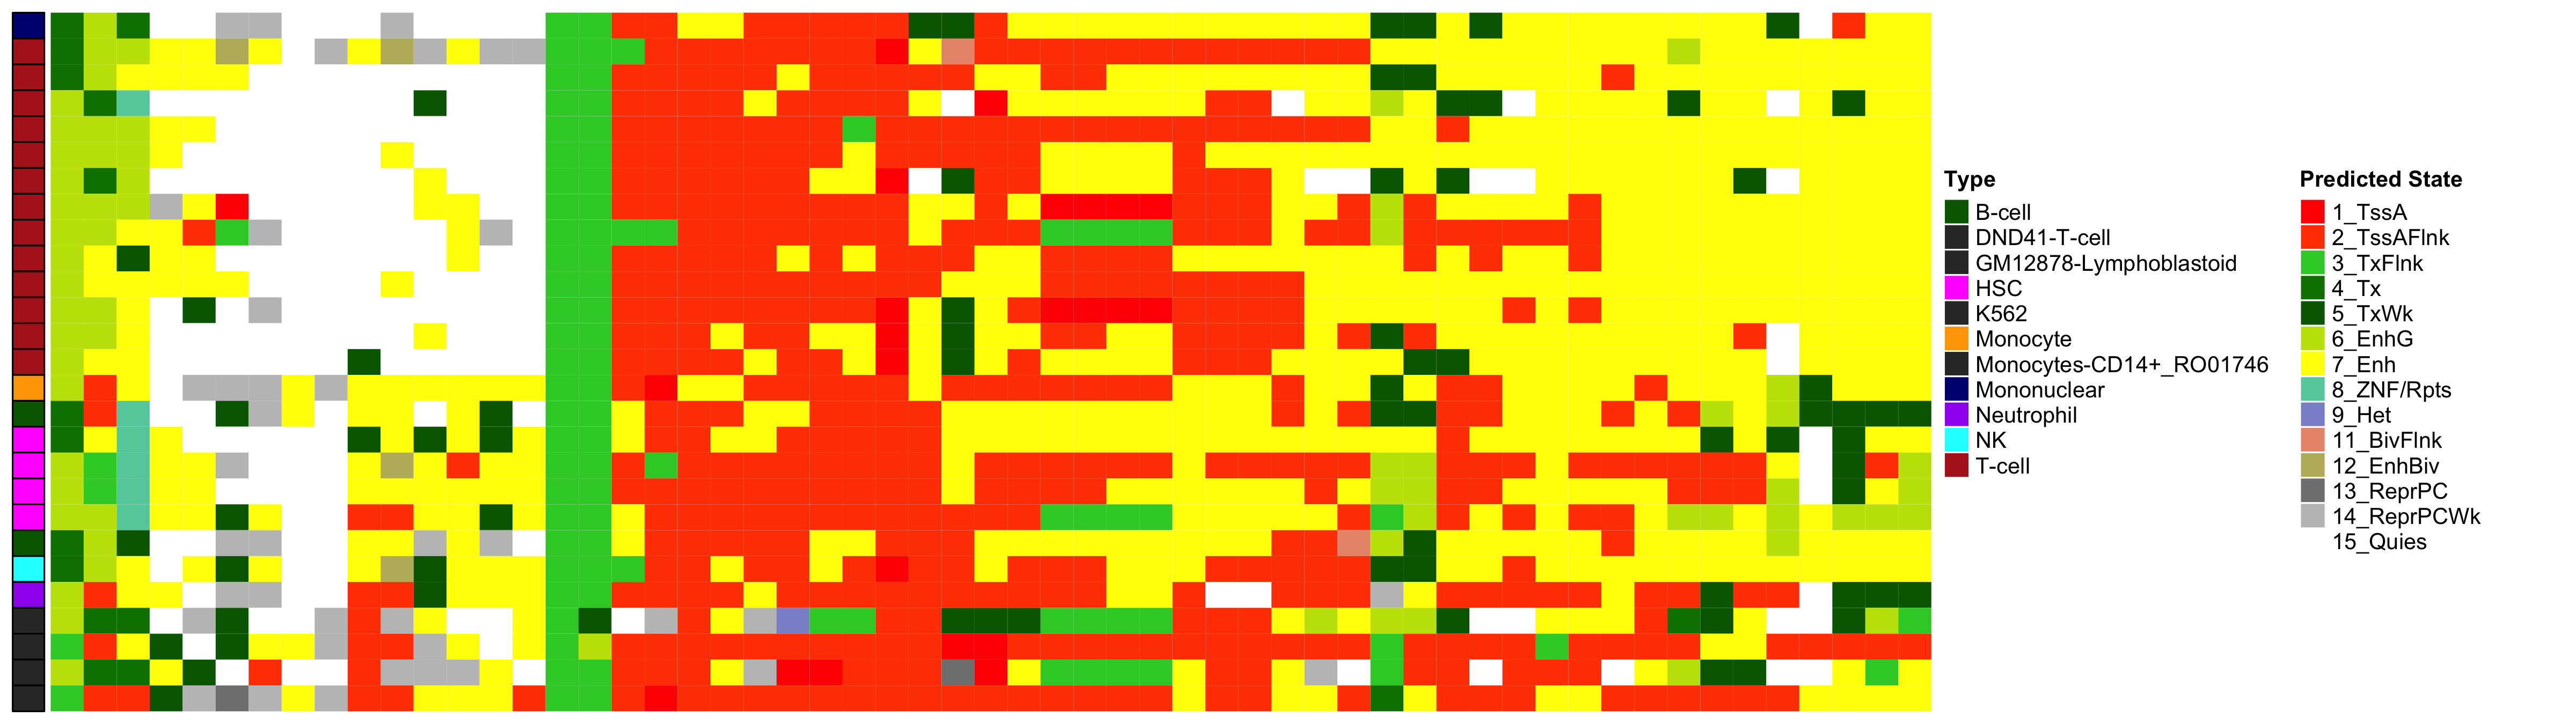
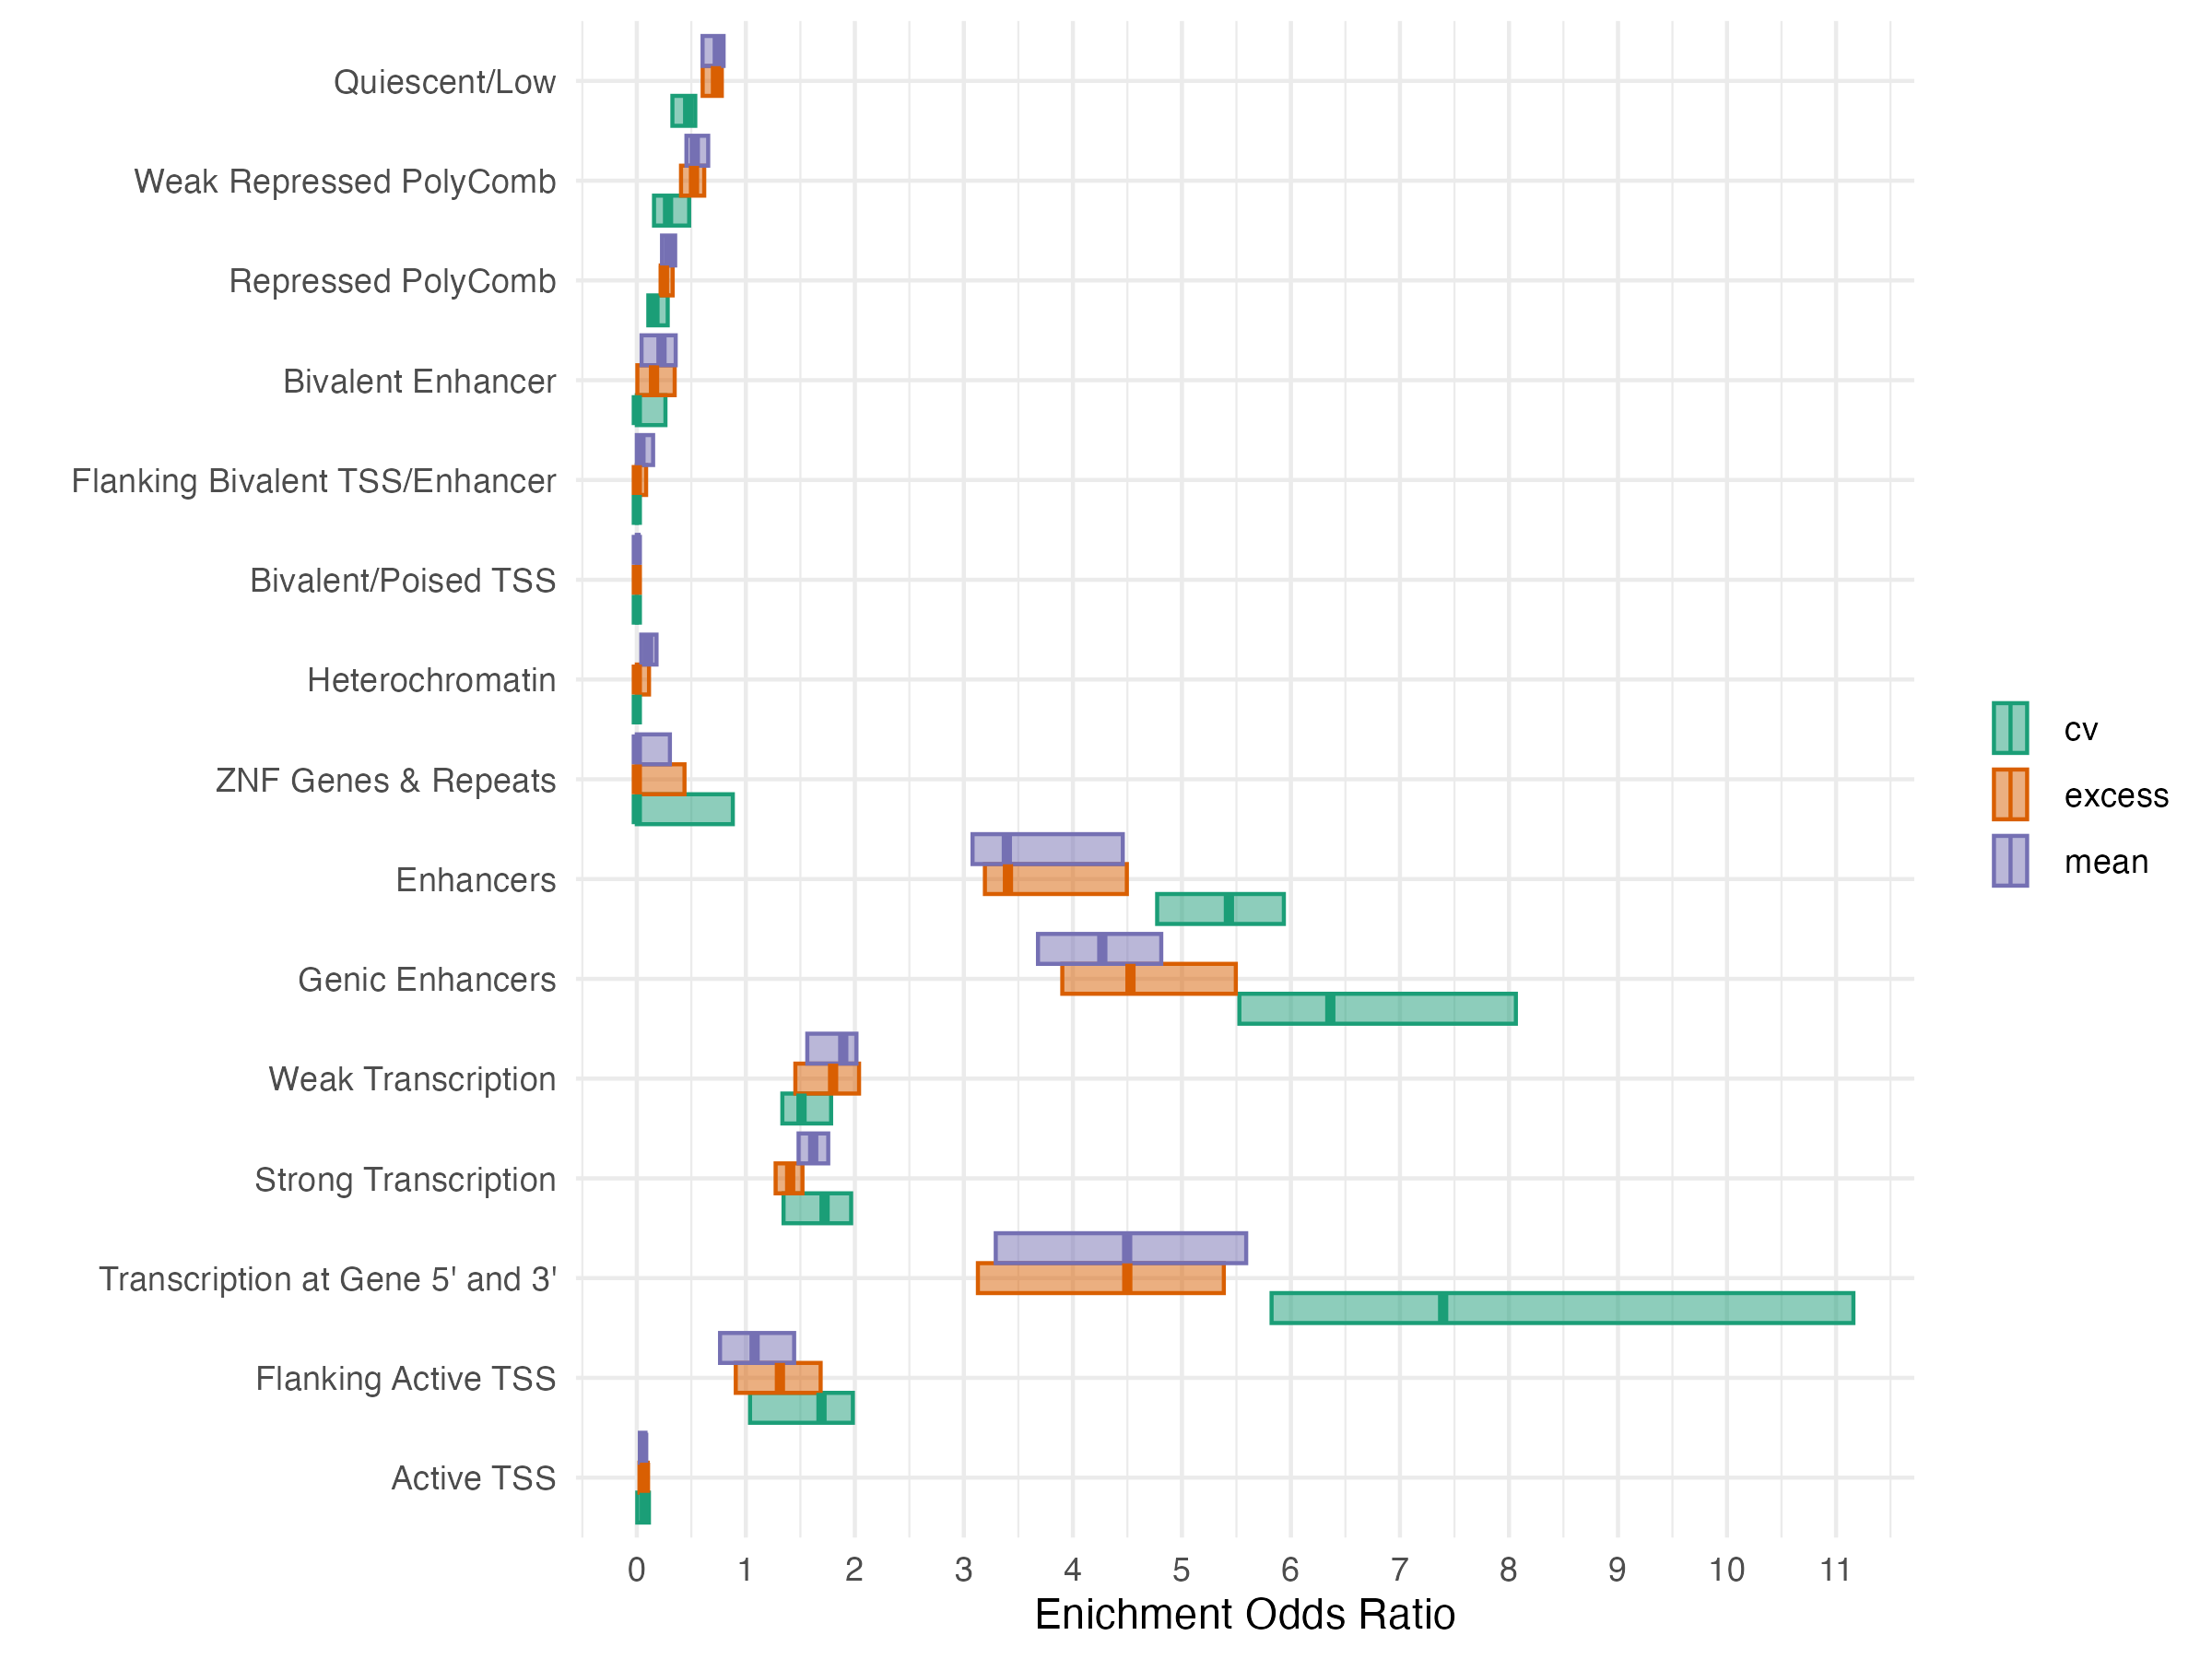
EWAS Functional Annotation - Chromatin State
Causal Mediation Model

Causal Mediation - Indirect Effects
Causal Mediation - Indirect Effects
- Max-P statistic is severely underdispersed relative to a uniform null distribution
| Exposure | NDE Estimate | Proportion Mediated |
|---|---|---|
| Excess | -0.500 (-0.504, -0.498) | 0.0121 (0.00997, 0.0143) |
| Mean | -0.535 (-0.538, -0.531) | 0.0108 (0.00990, 0.0118) |
| CV | -0.197 (-0.200, -0.192) | 0.0221 (0.01232, 0.0495) |
Causal Mediation - Volcano Plot
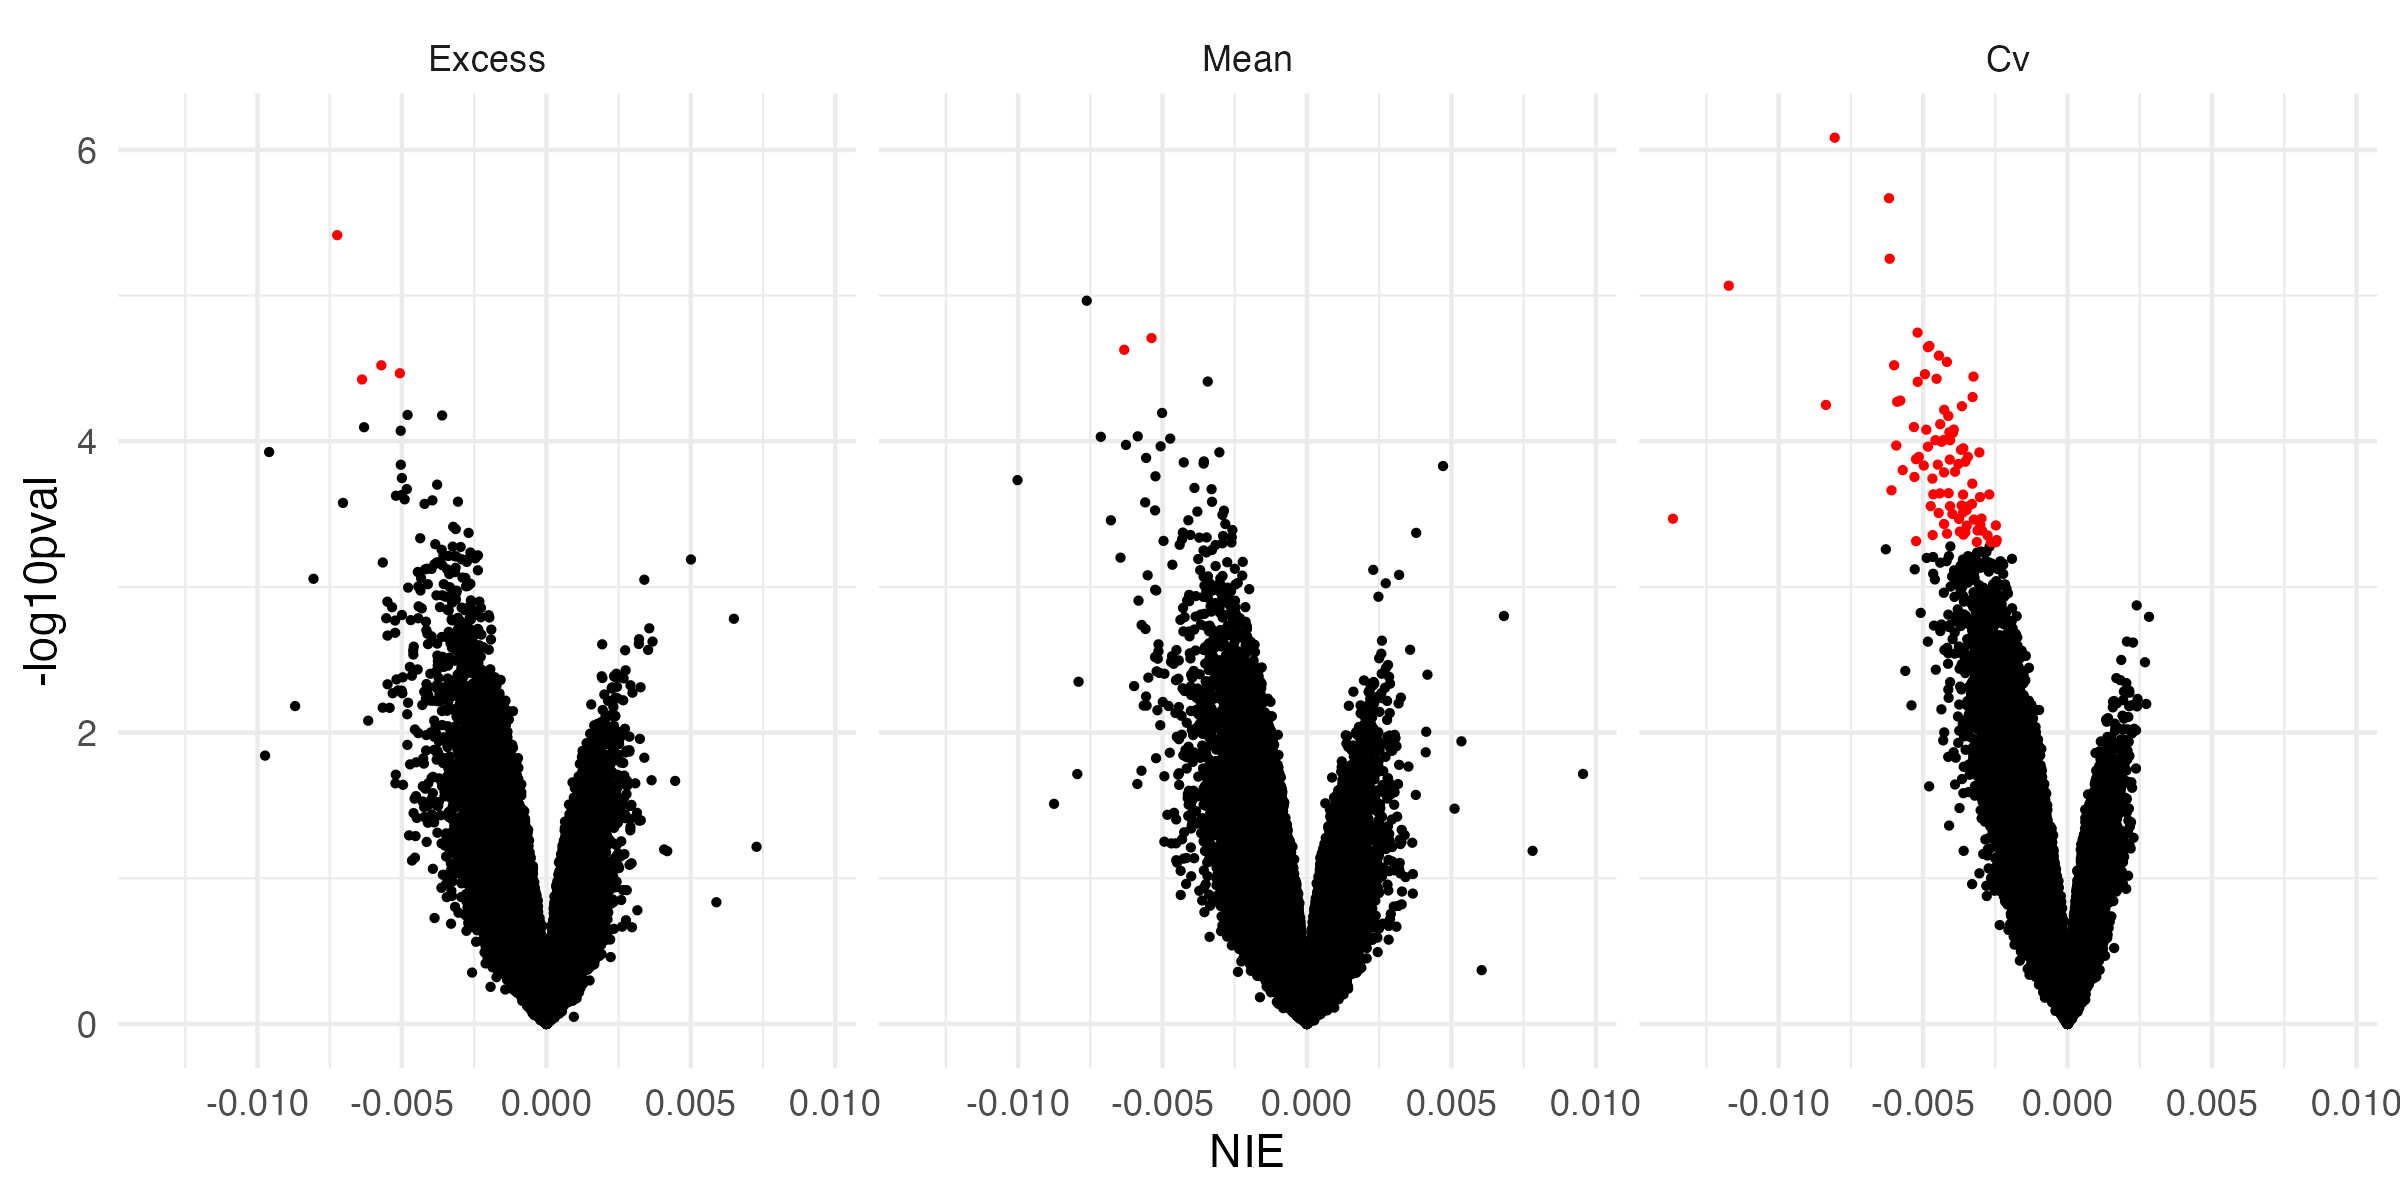
- At all significant mediators, increased glycemic exposure is associated with a decrease in time-to-retinopathy
Causal Mediation - Indirect Effects
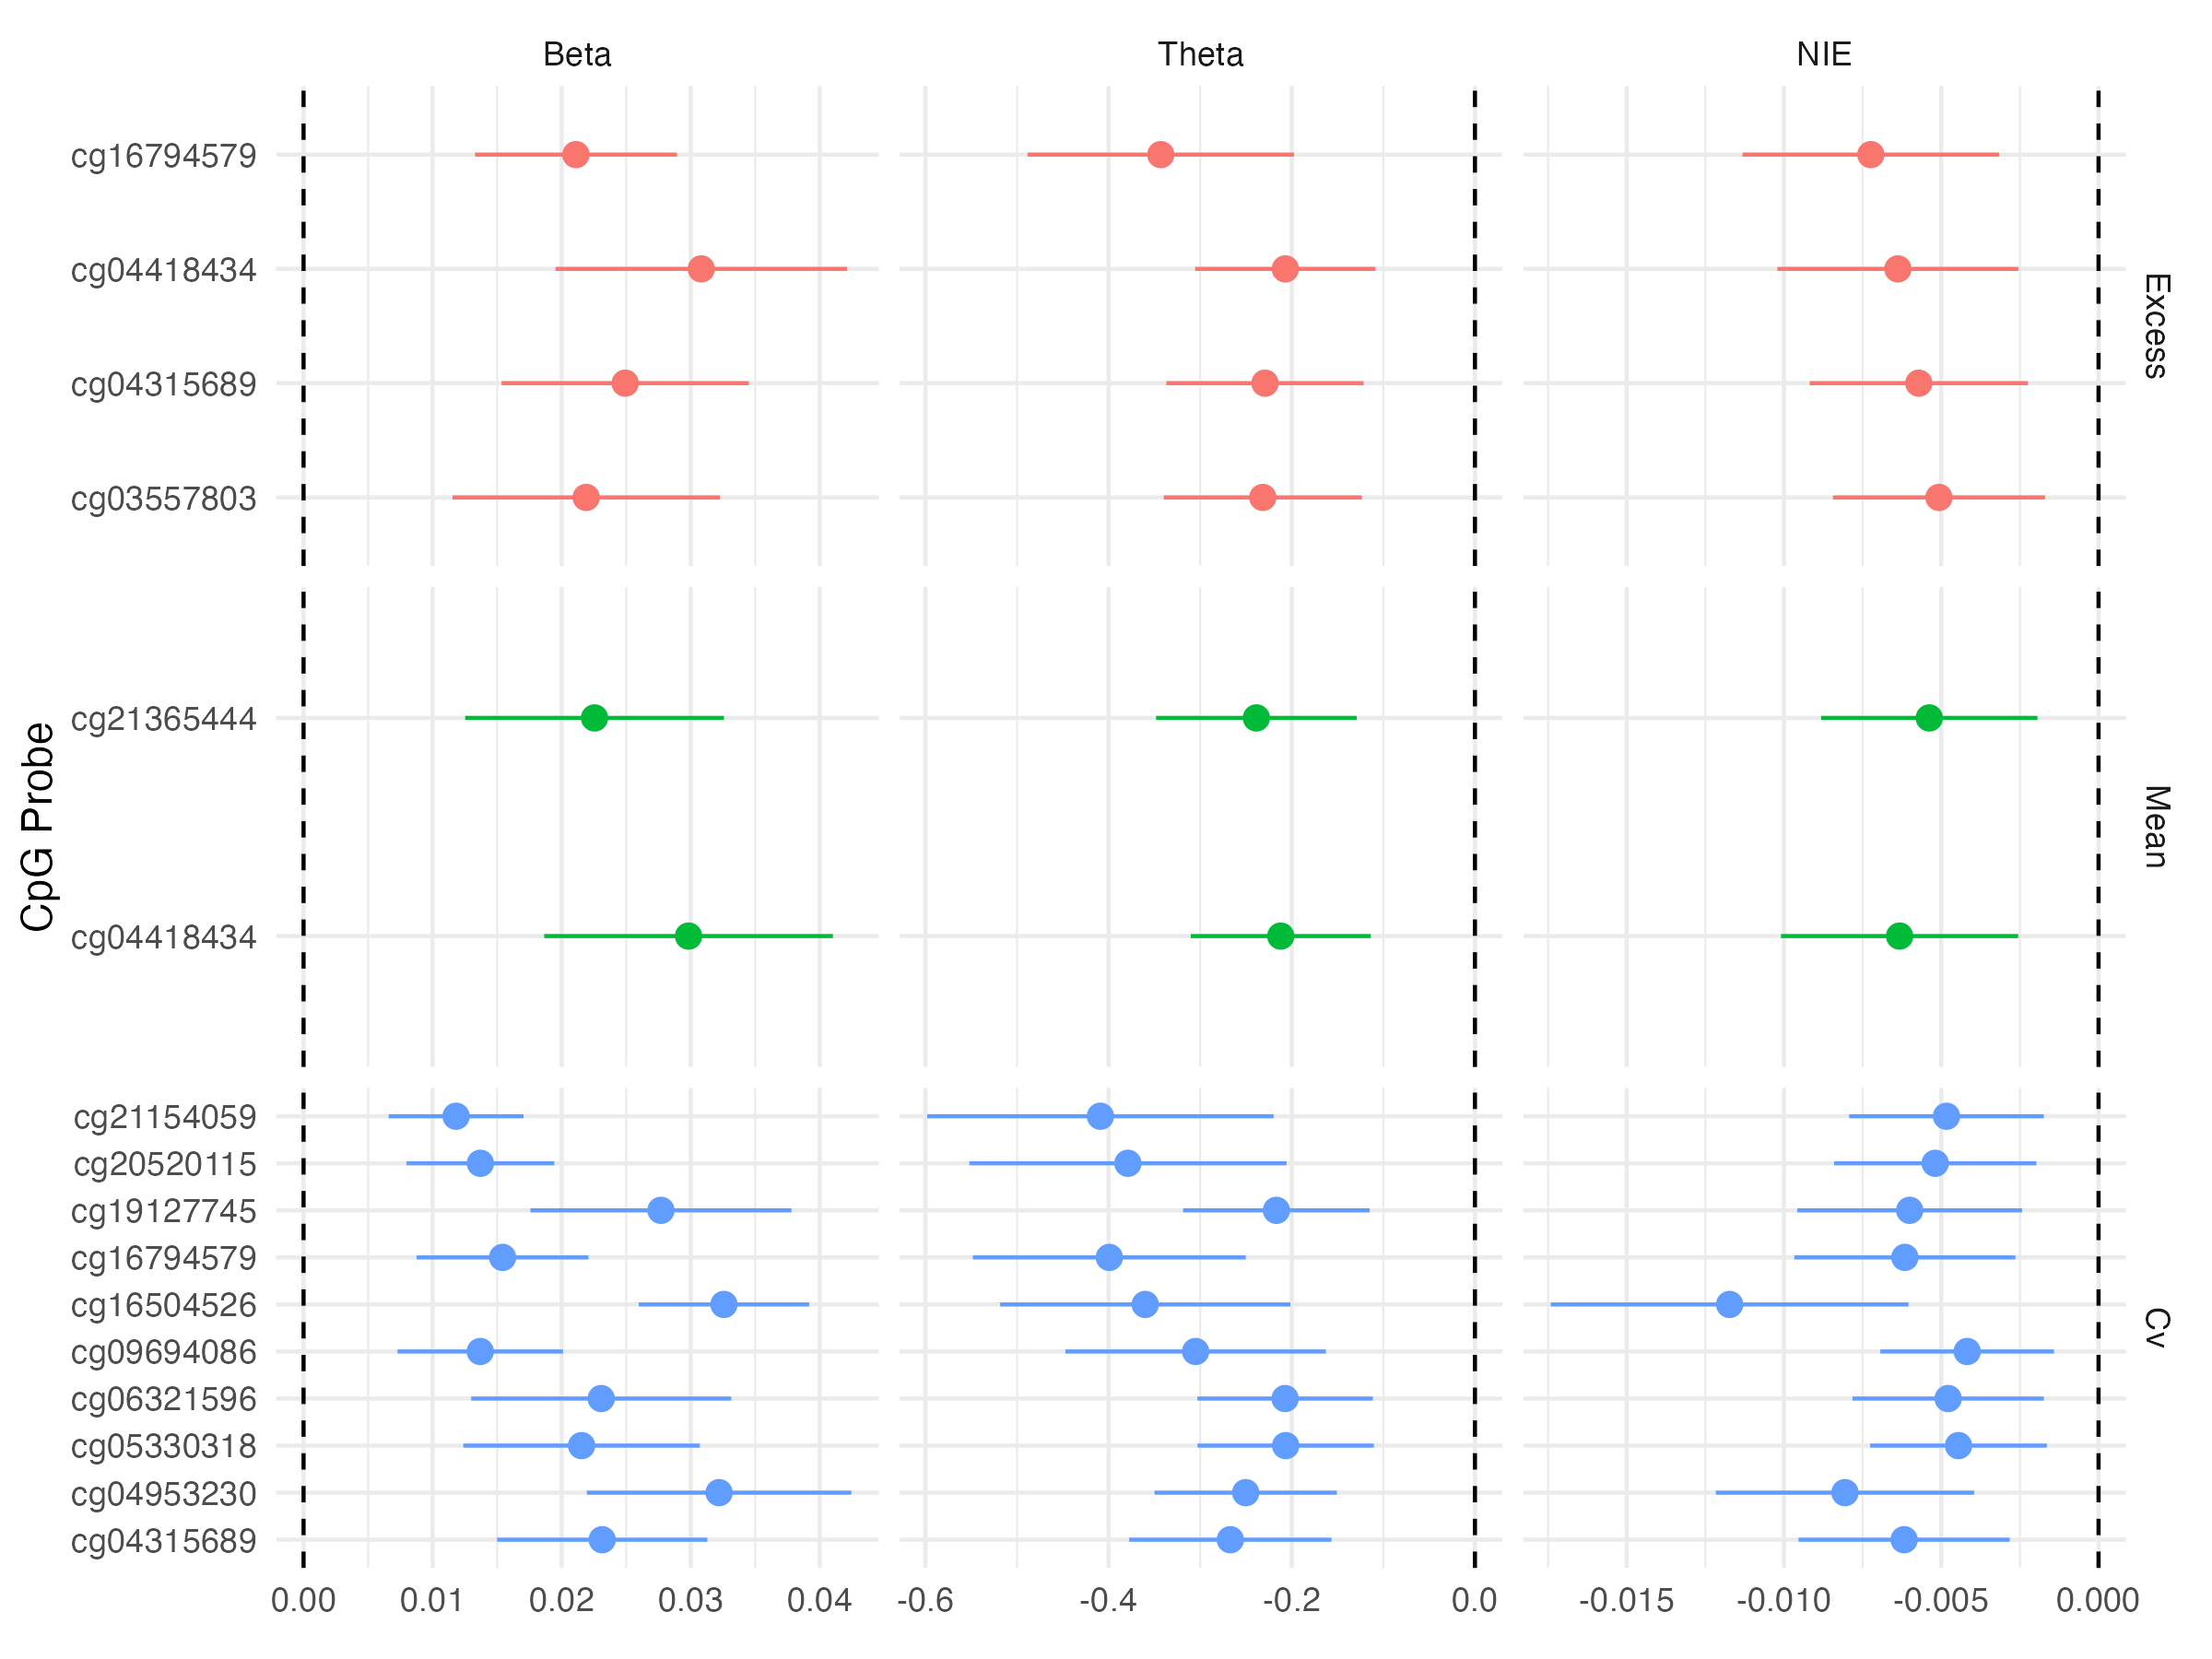
Expected changes in methylation given changes in glycemic exposure appear to be relatively small
Individual CpG sites do not capture much of a mediation effect of glycemia on time-to-retinopathy
Mean and excess HbA1c effect on retinopathy onset is marginally mediated by methylation at two and four CpG sites, respectively
- Mean and excess HbA1c are associated with
cg04418434is hypermethylated in the 5’UTR region of RREB1 cg04418434is hypermethylated in the 5’UTR region of RREB1
- Mean and excess HbA1c are associated with
CV HbA1c’s effect on DR onset is mediated at 87 CpG sites
Footnotes
interval between the date of the first DM diagnosis code to MVP sample collection date