Mediation of Glycemia Exposure in on Time-to-Retinopathy in Type 2 Diabetes
0.1 Study Objectives
- Identify differentially methylated CpG sites associated with glycemia exposures
- Identify differentially methylated CpG sites associated with diabetic complications
- retinopathy
- nephropathy
- Determine whether the identified CpG sites are responsible for the association between glycemia exposures and DM complications
0.2 Cohort Identification

- Subjects must have
- \(\ge 1\) DM Dx code or equivalent in pre-period to be included
- \(\ge 3\) HbA1c measurements in at least two distinct years, in the 5 years prior to blood sample collection
- In MVP, currently have a sample of 12,037 T2D subjects with methylation data and meet the inclusion criteria
0.3 Outcome Definition
Use available patient level EHR data to identify Type 2 diabetic subjects
- Diagnosis codes alone may fail to capture subjects diagnosed outside of the VA
Diabetic Retinopathy identified by algorithm defined in (Breeyear et al. 2023):
0.4 Epigenome-Wide Association Study
Hypothesis: High HbA1c has a cumulative effect on DNA methylation levels
EWAS covariate of interest: historical HbA1c level 5 years prior to DNA methylation sample collection:
EWAS covariates for adjustment (base model): sex, age, cell composition, genetic principal components, potential batch effects, duration of diabetes1(Yang et al. 2024) prior to MVP blood sample collection
- Duration of diabetes is left-censored, additional analyses were conducted with patients newly diagnosed with T2D within the VA system, with similar findings.
\[ \begin{aligned} M &\sim \text{HbA1c Exposure + sex + age + HARE ancestry}\\ &\qquad+ \text{ Time since Diabetes Dx (years) + cell composition + batch effects} \end{aligned} \]
where \(M = \log_2\left(\frac{\beta}{1 - \beta}\right)\).
0.5 Exposure Definitions

All exposures are defined using HbA1c measurements collected from five years prior up to and including the MVP sample collection date
- Mean HbA1c level
- Excess HbA1c level
- Threshold set at 6.1% HbA1c (see Miller and Orchard (2020))
- CV of HbA1c level
| Exposure | Mean | SD | 95%CI lb | 95%CI ub |
|---|---|---|---|---|
| Mean (%) | 7.36 | 1.27 | 5.60 | 10.50 |
| Excess (%) | 6.59 | 6.29 | 0.00 | 10.66 |
| CV | 0.10 | 0.08 | 0.02 | 0.30 |
HbA1c measurements below 4% and above 18% were excluded
1 Preliminary EWAS Results
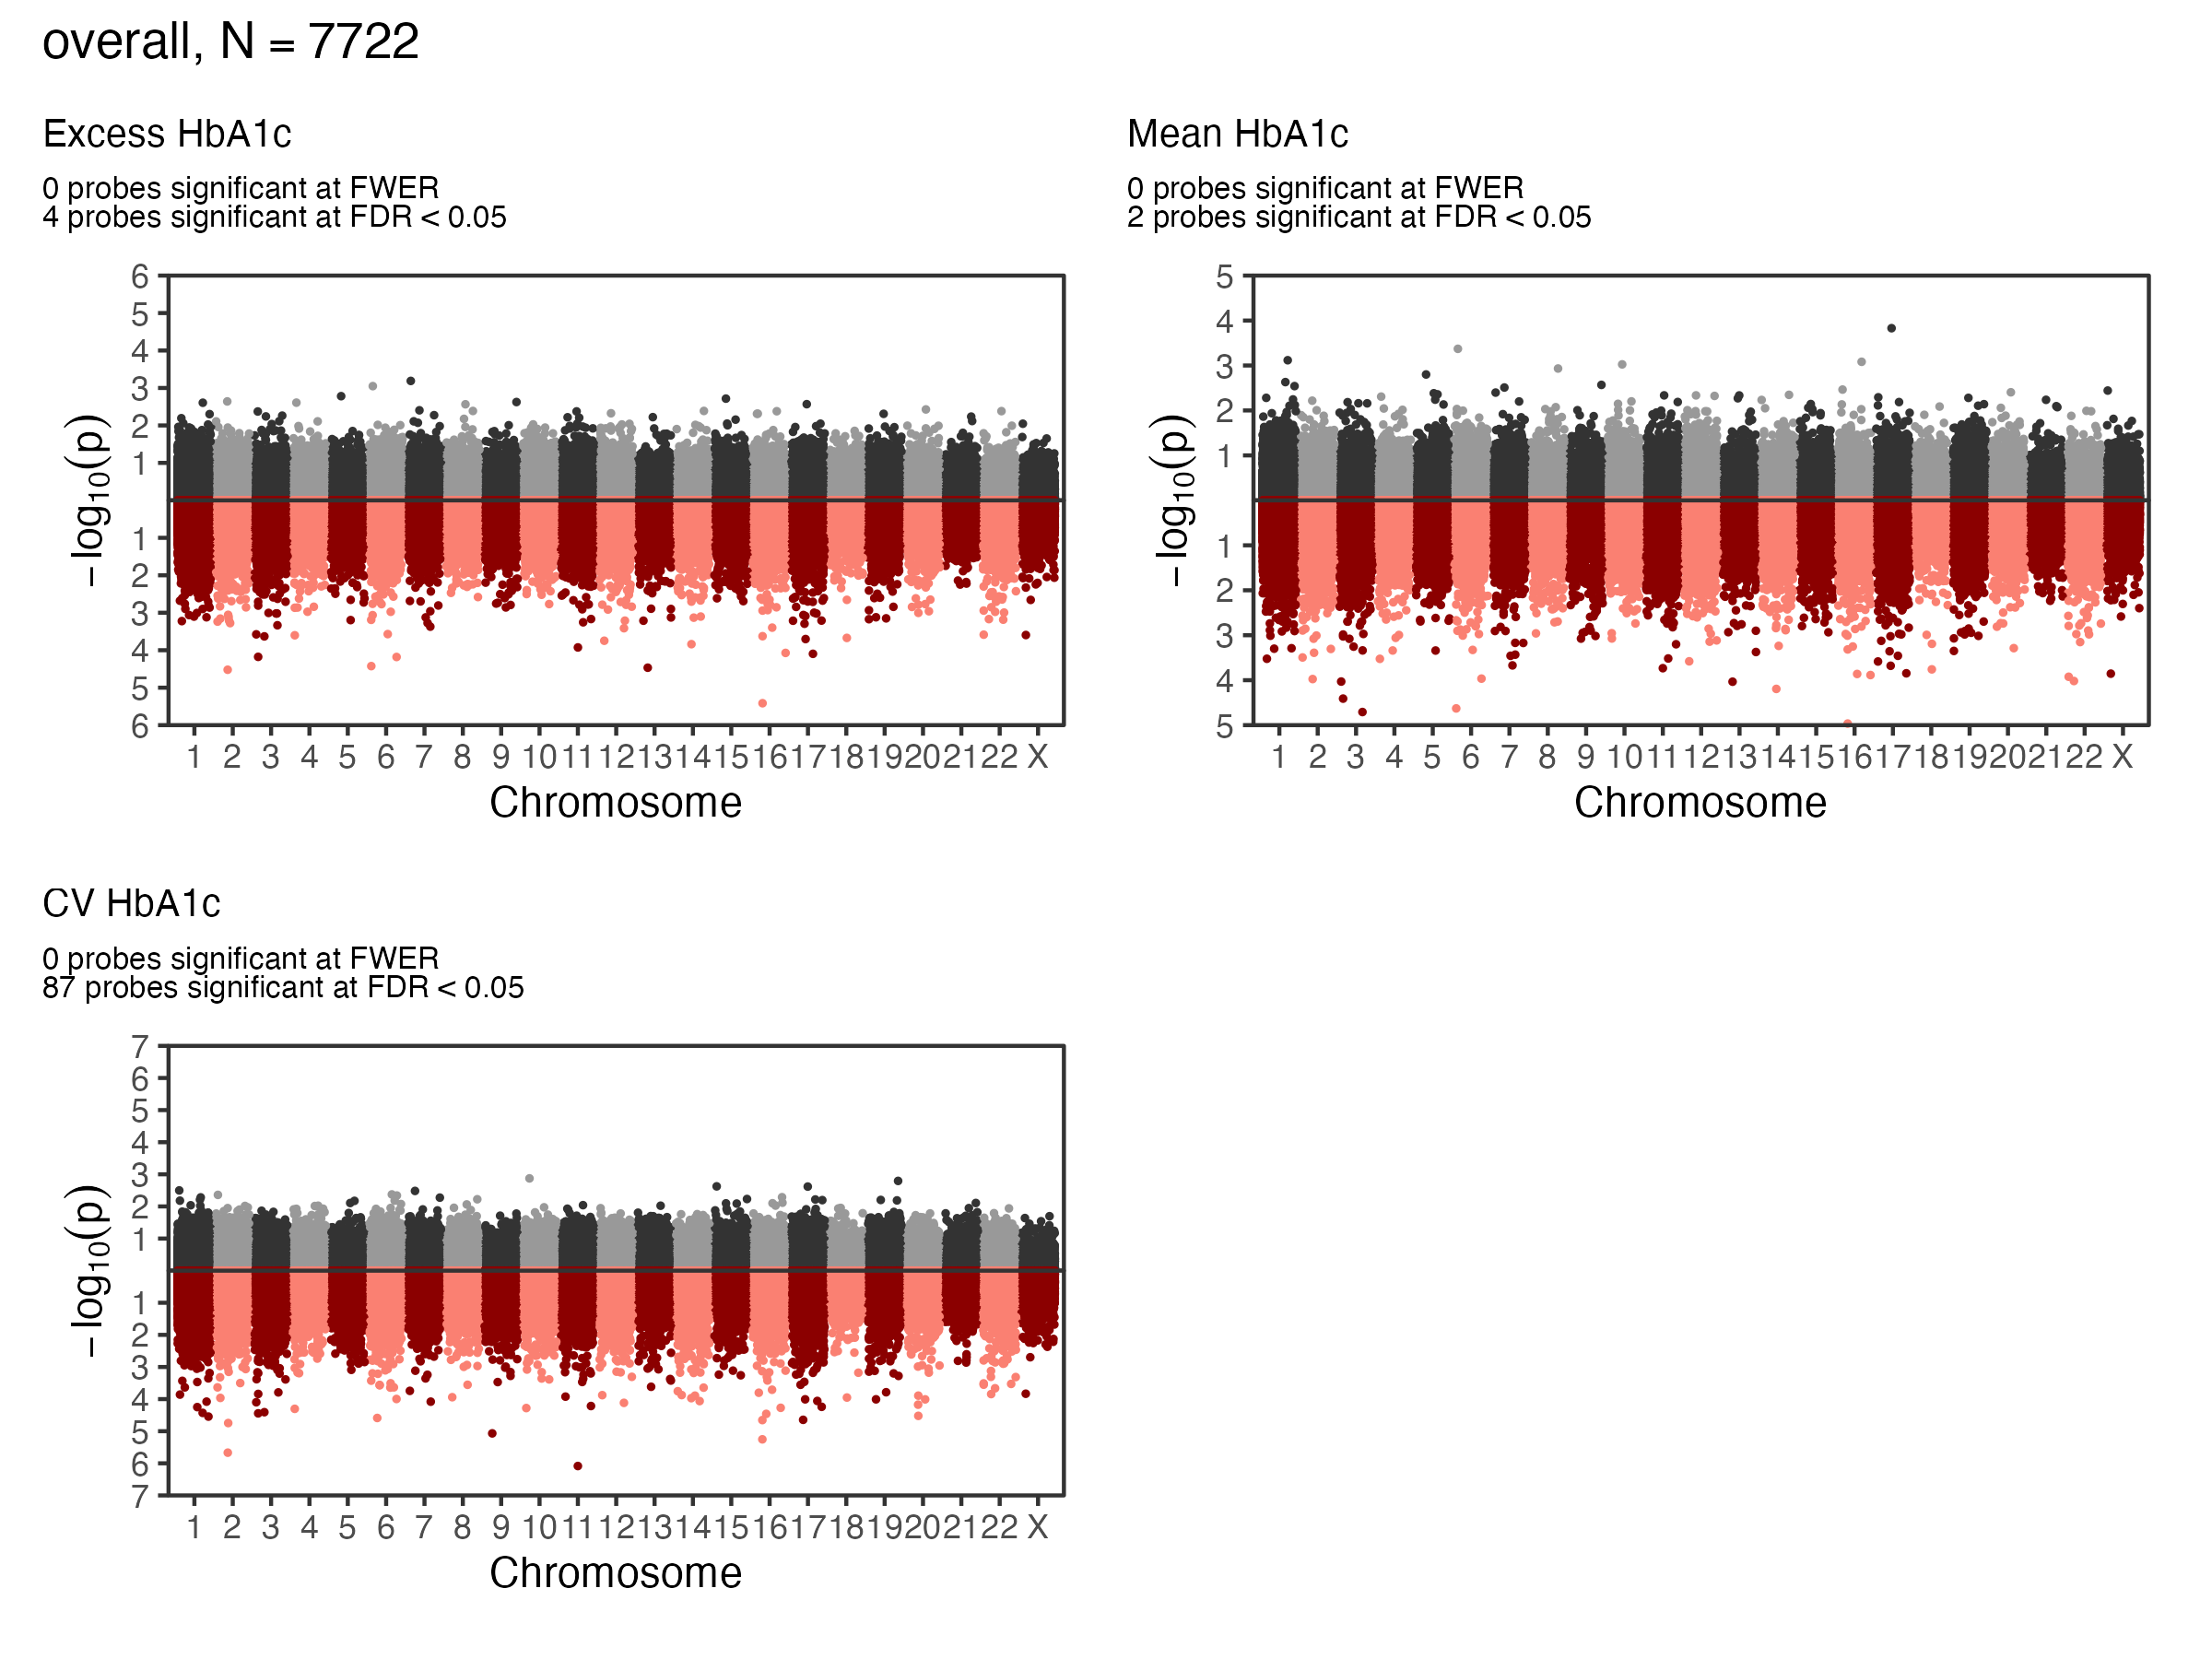
1.1 EWAS Results - A1c - Overall
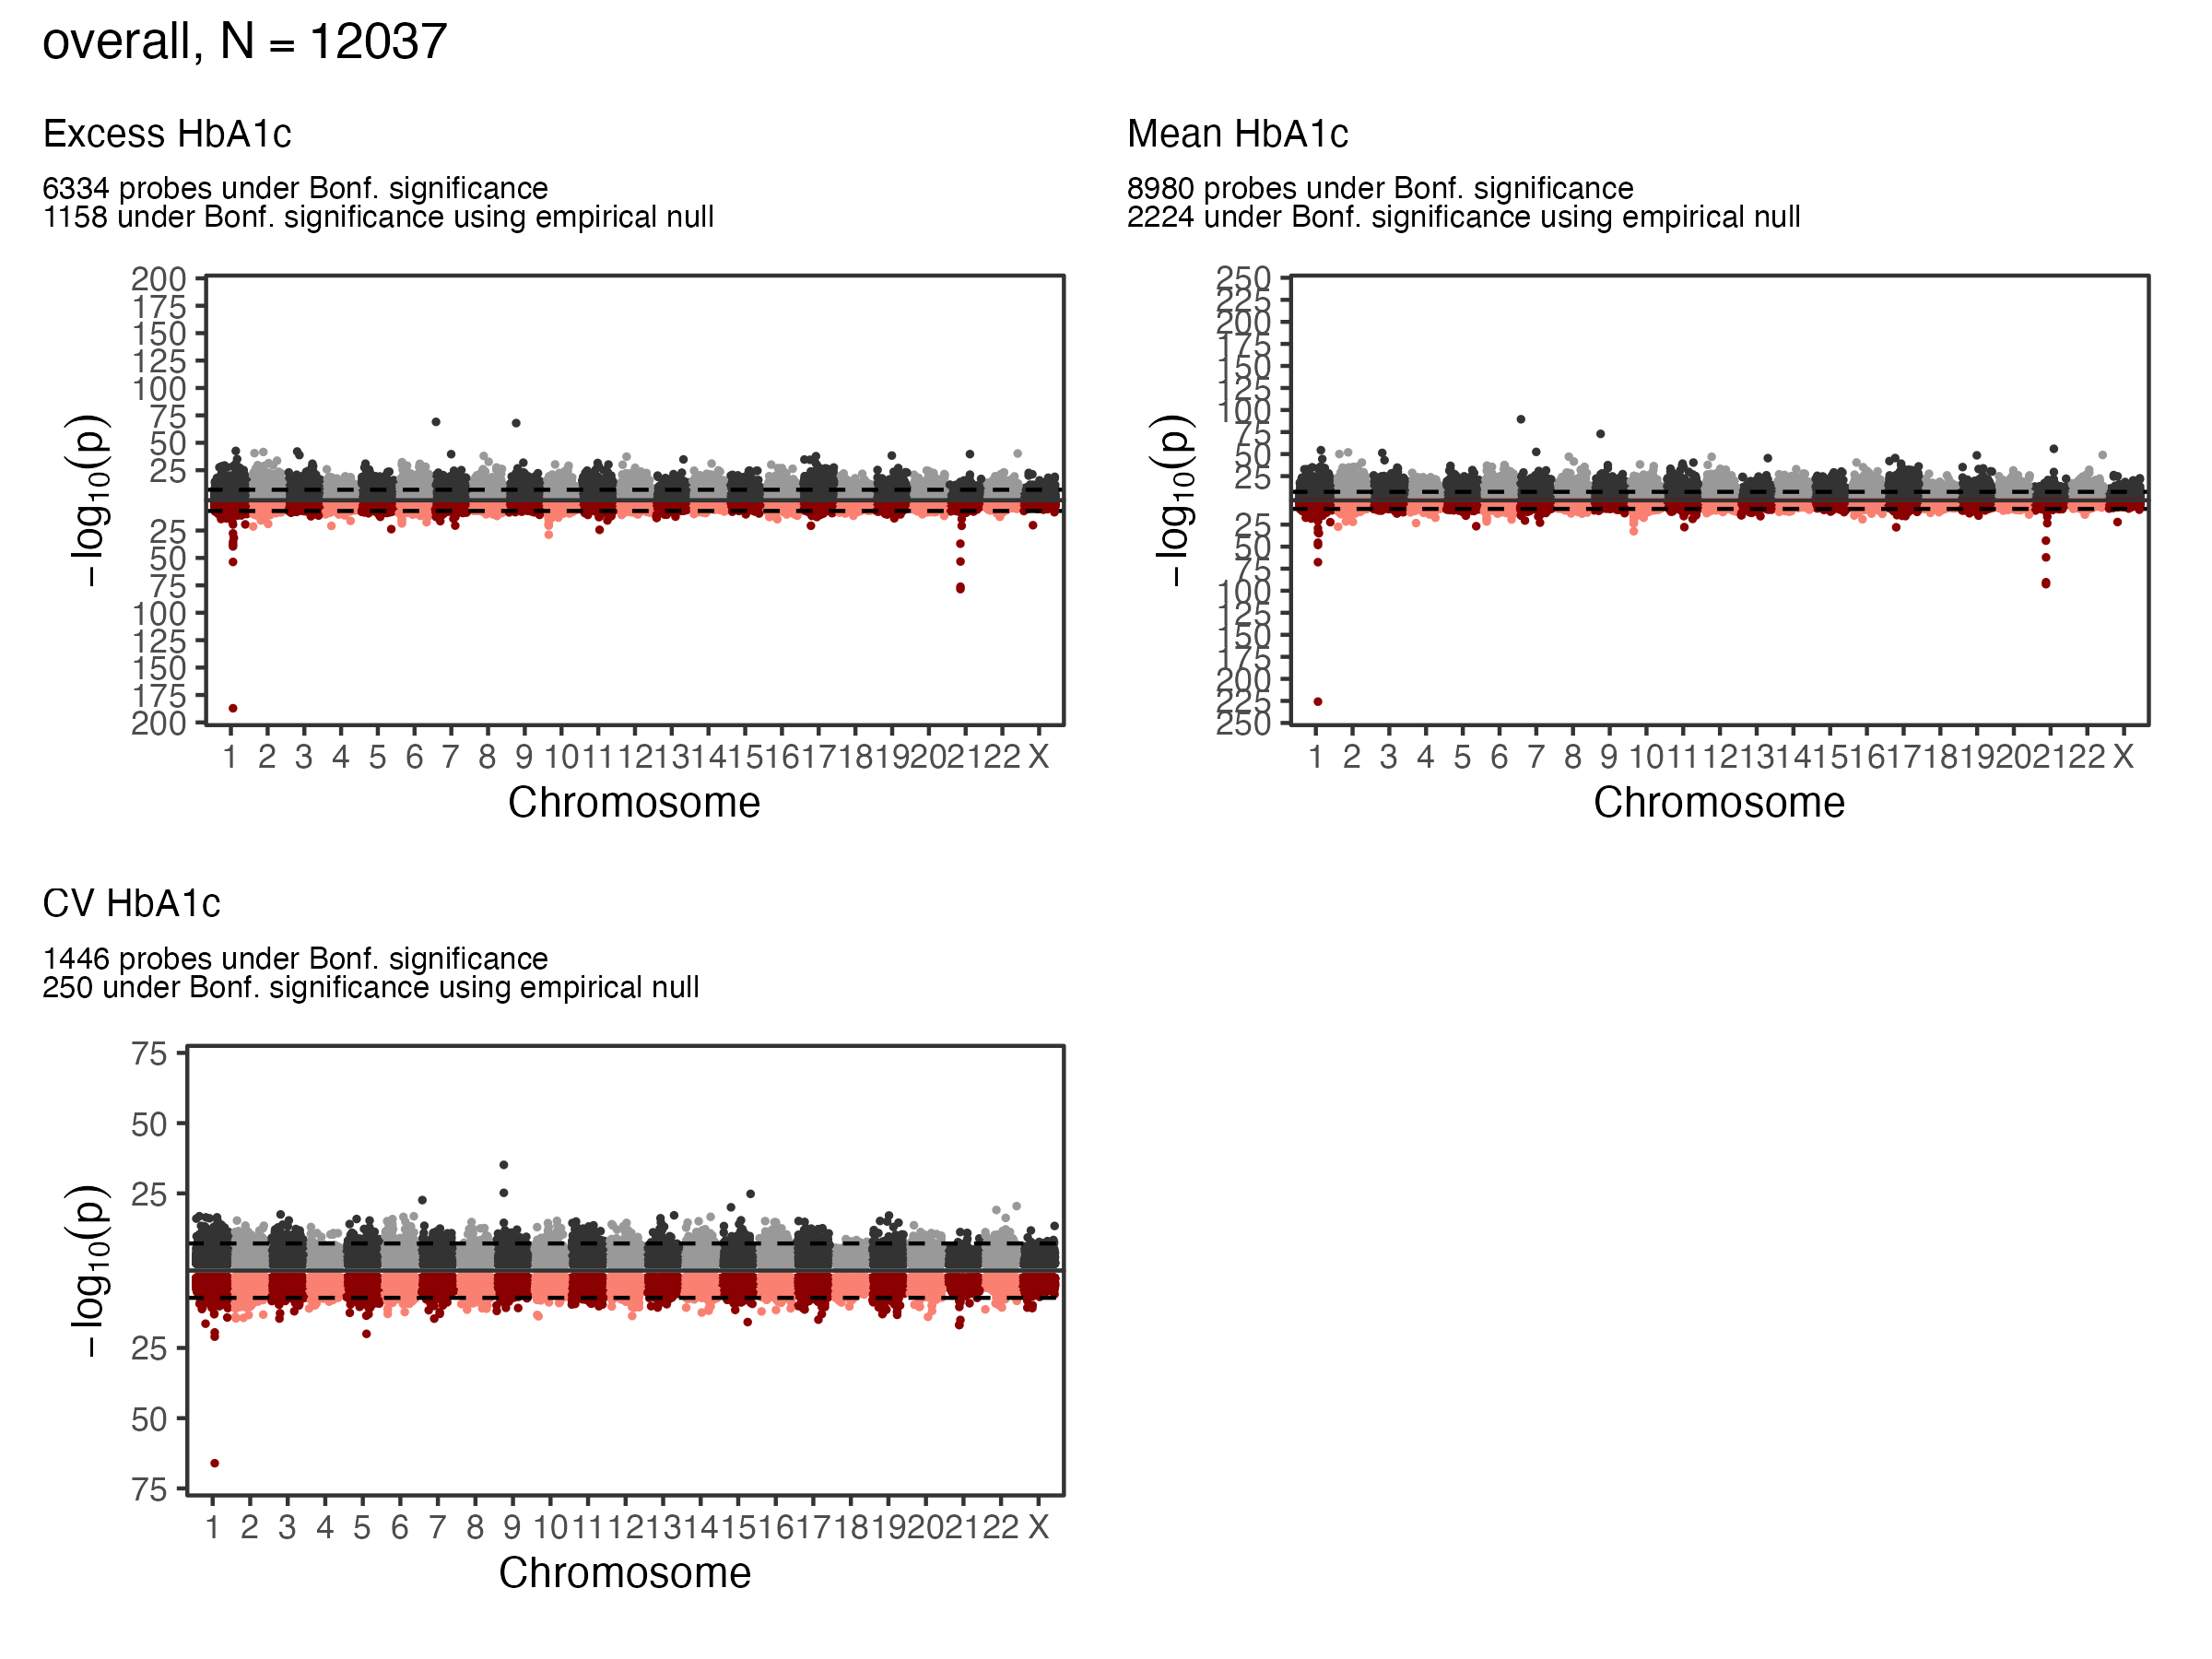
1.2 EWAS Results - A1c - Overall
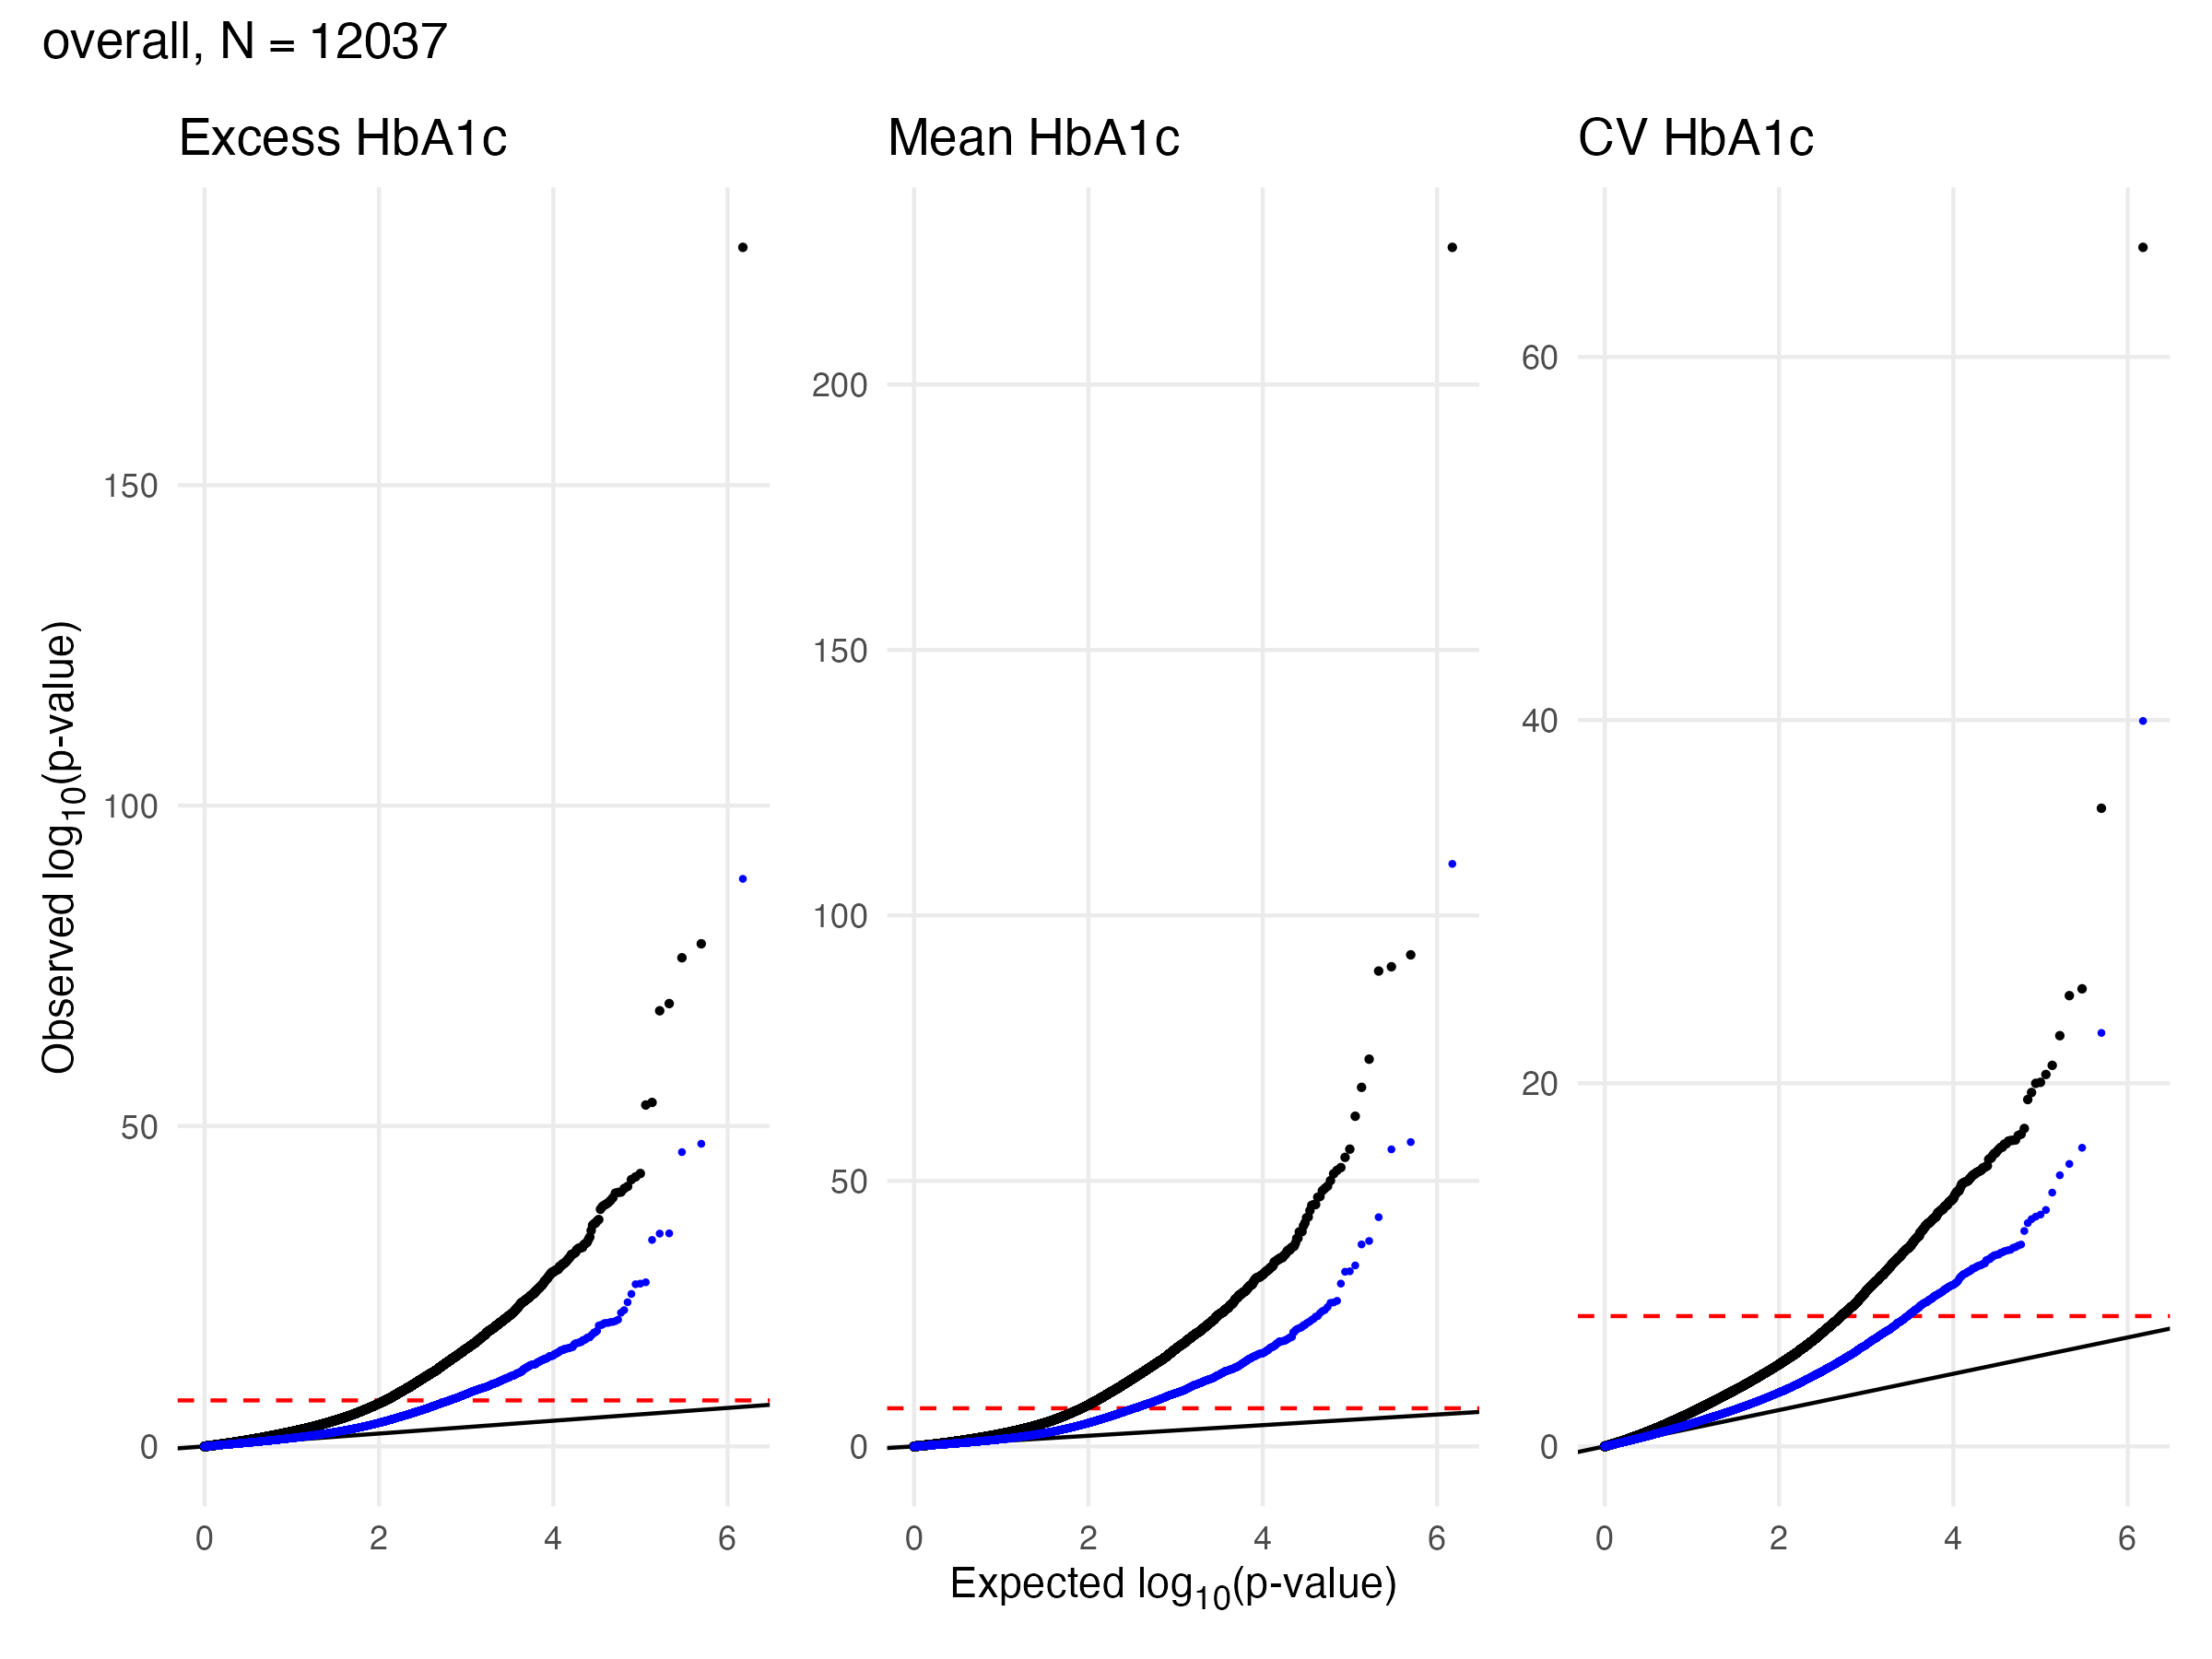
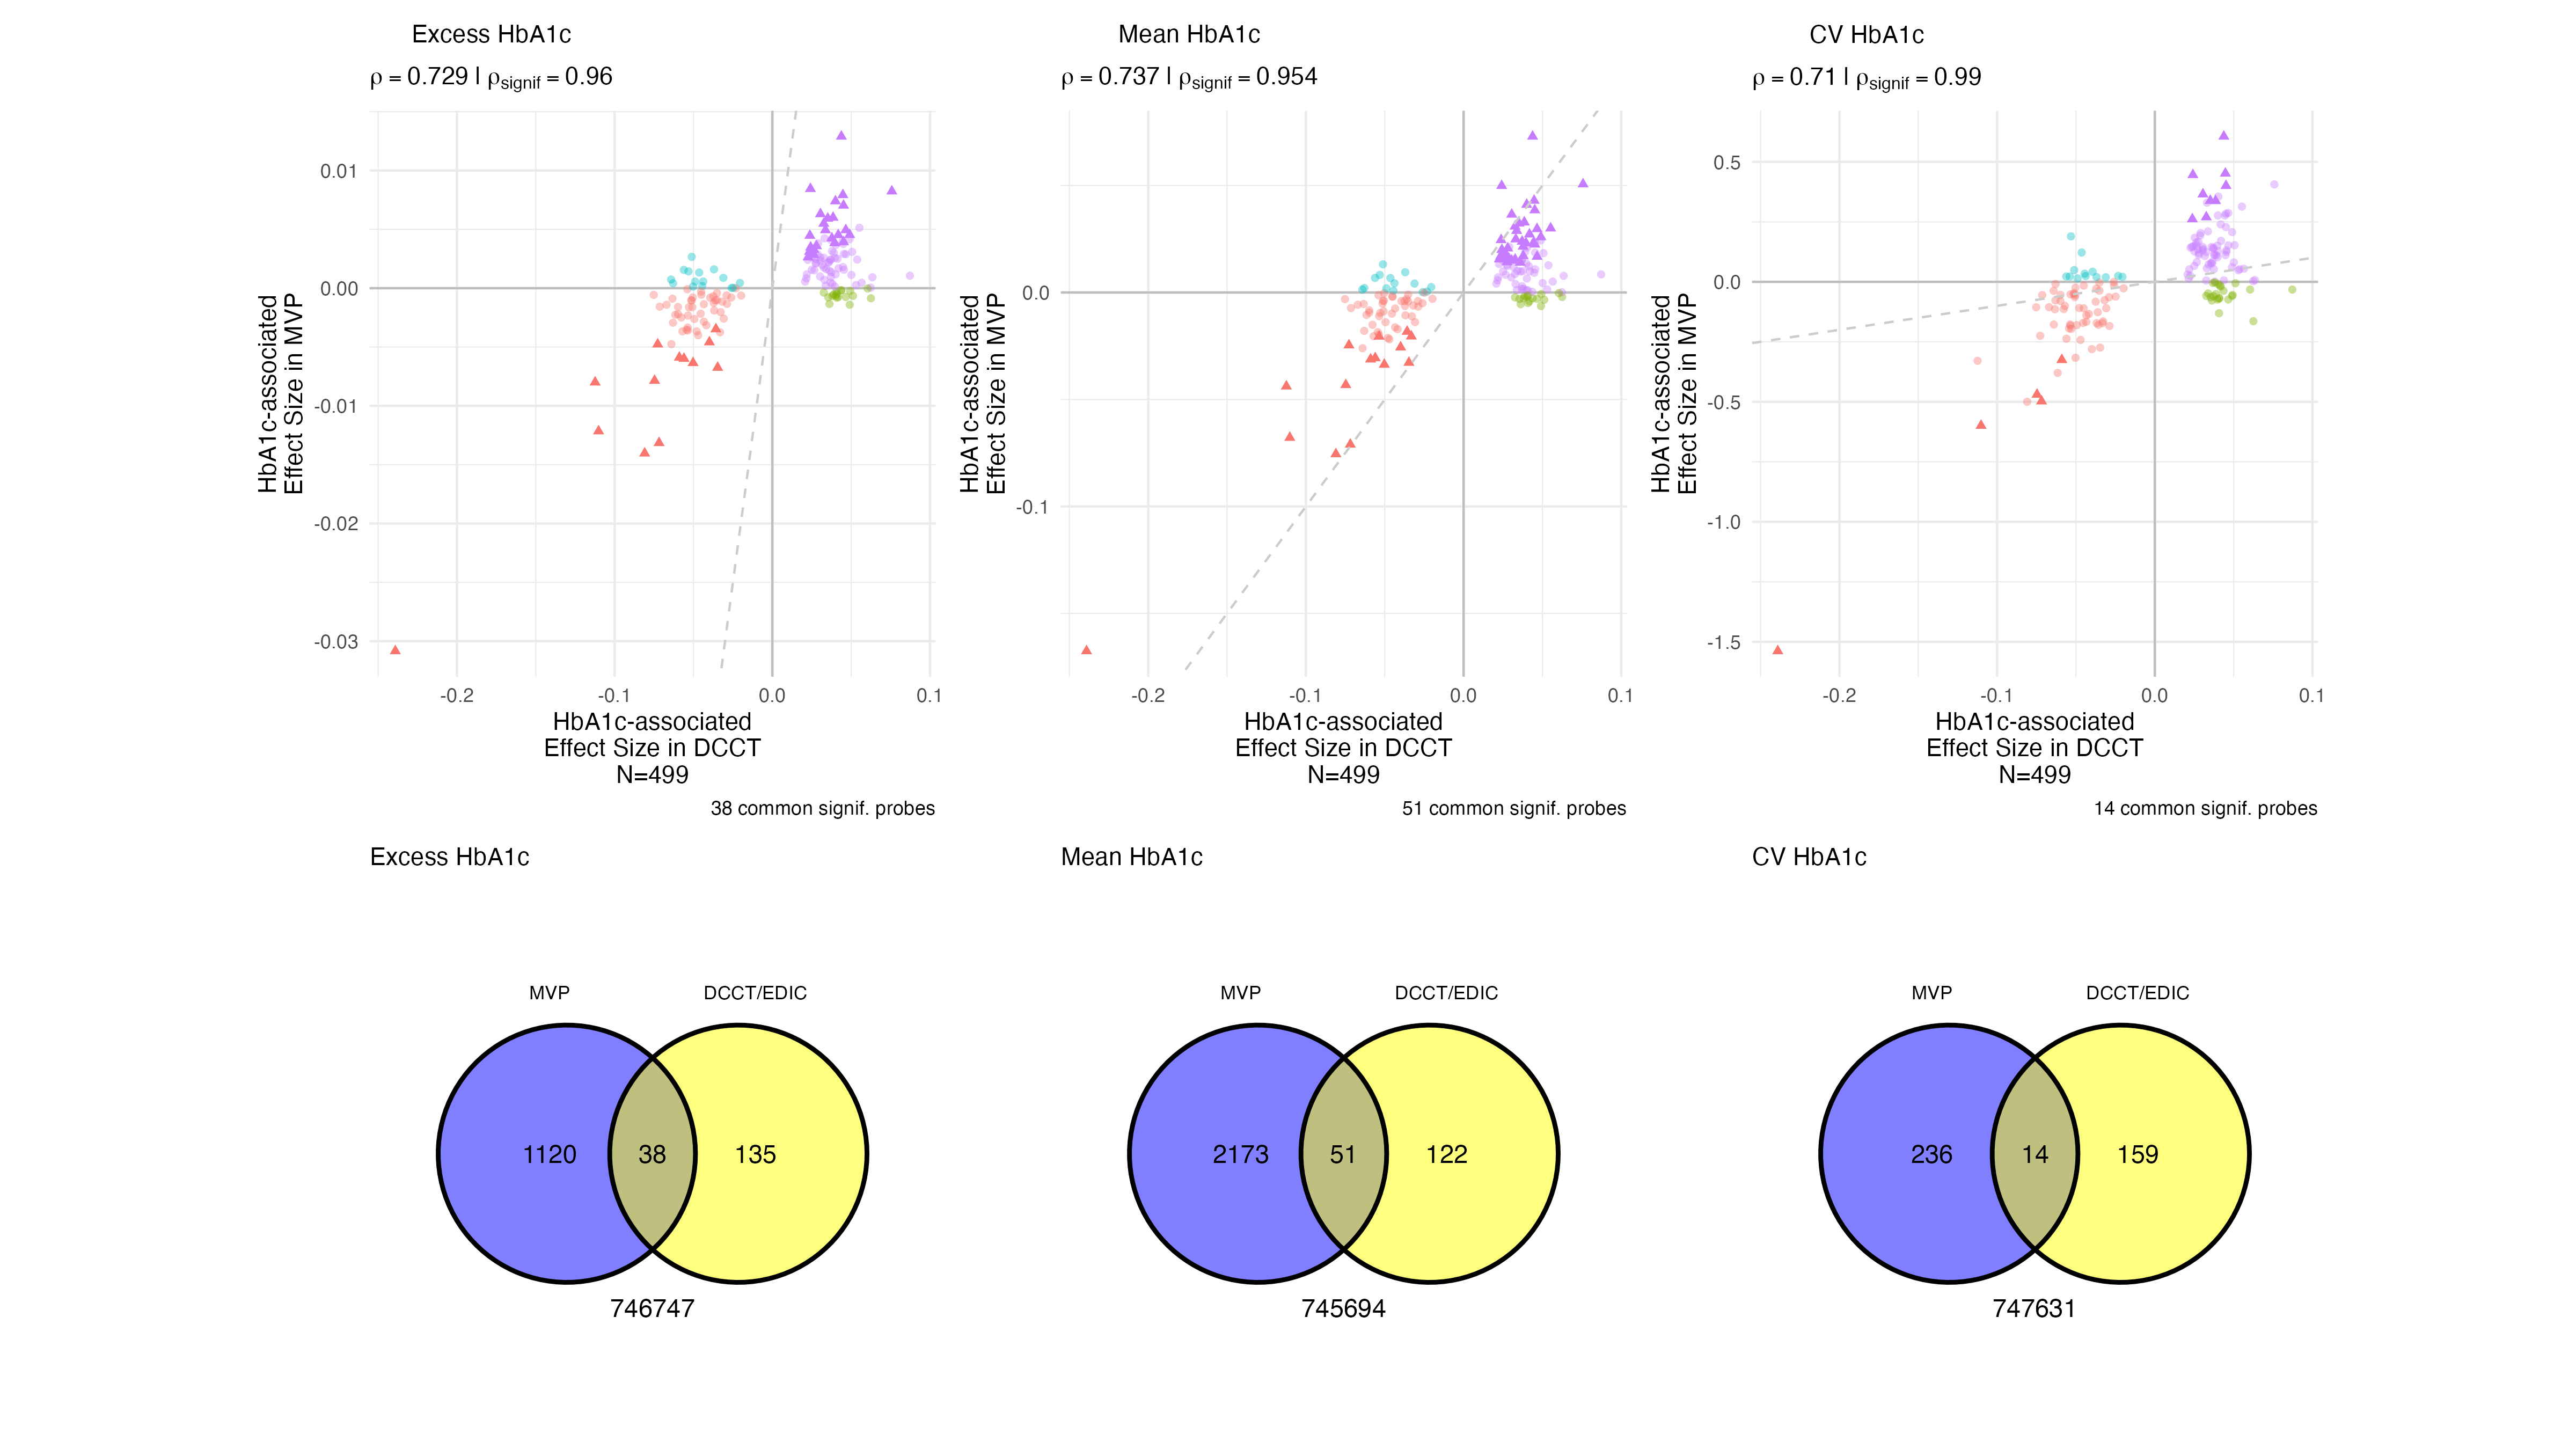
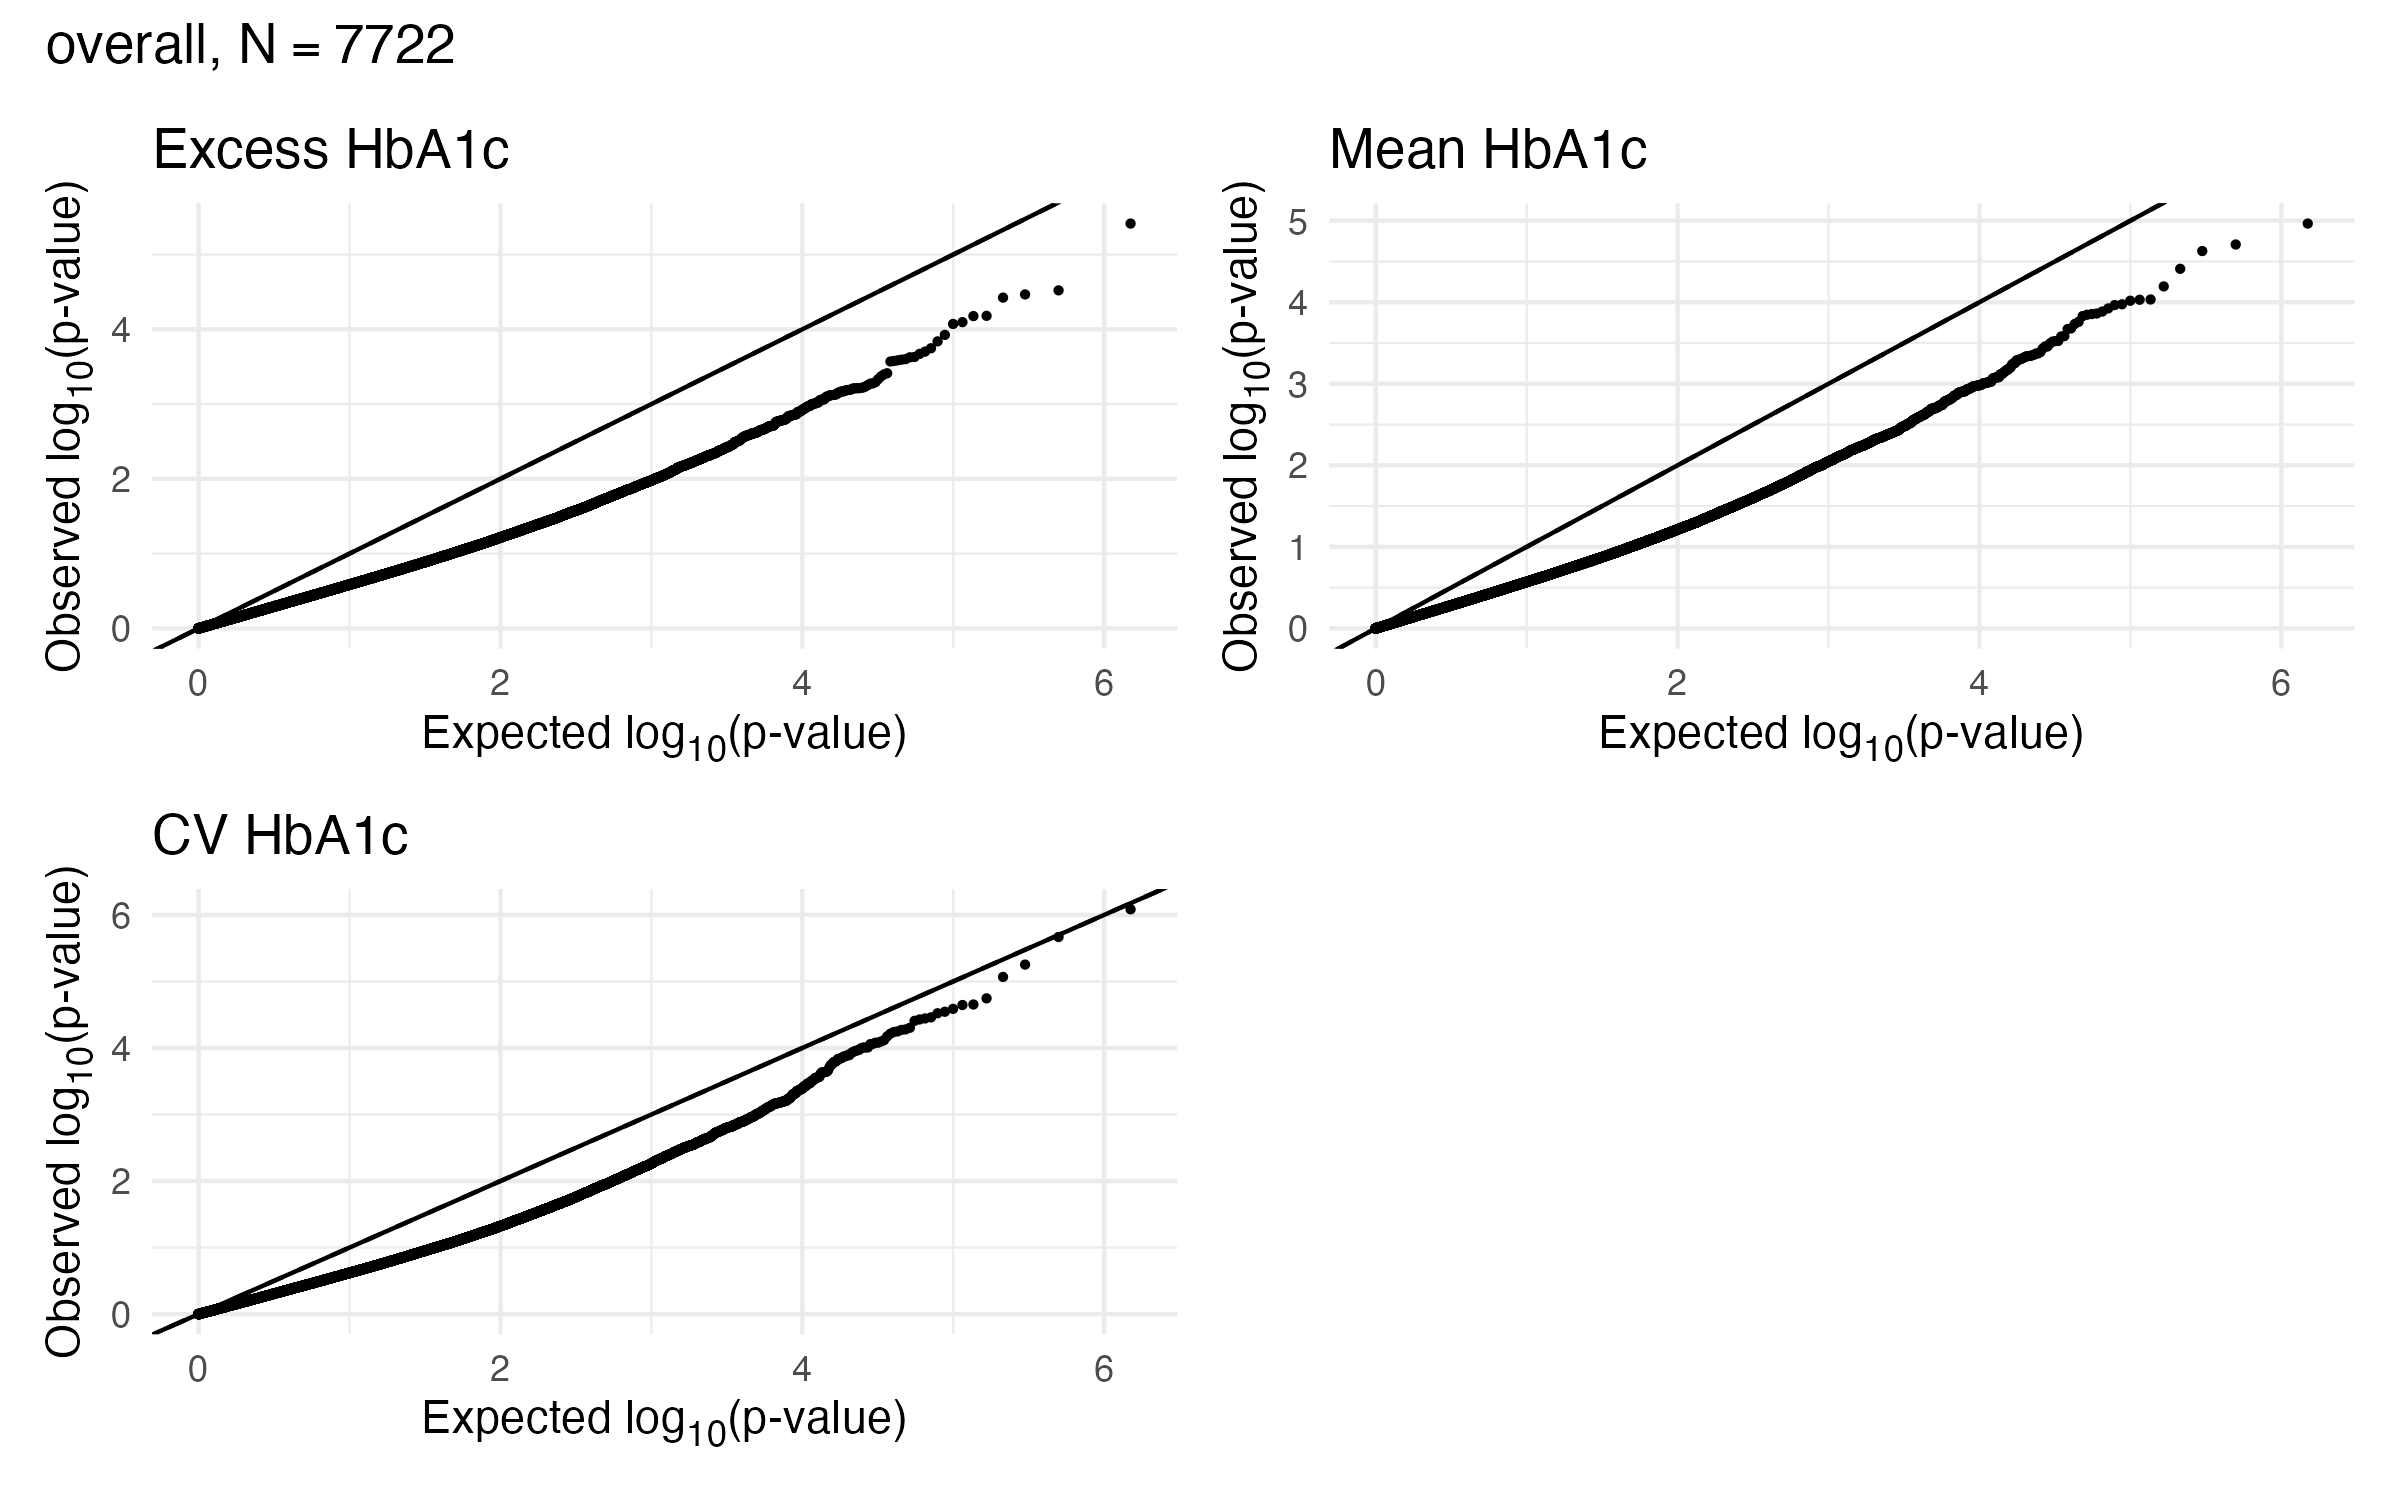
1.3 EWAS Validation - A1c - Overall
1.4 EWAS Results - A1c - Annotation
- GREAT(McLean et al. 2010) was used to identify genes significantly enriched in glycemia associated CpG sites for each exposure at FDR < 0.05
| Exposure | Signif. CpGs | Gene Count |
|---|---|---|
| Excess | 1158 | 35 |
| Mean | 2224 | 63 |
| CV | 250 | 8 |
| Any Exposure | 2303 | 74 |
| All Exposures | 159 | 3 |
1.5 EWAS Results - A1c - Annotation
| Gene | Chr | Name | Found in Chen 2020 |
|---|---|---|---|
| TXNIP | 1 | thioredoxin interacting protein (Miller et al. 2023; Tsai et al. 2022; Chen et al. 2016) | Y |
| BRD7 | 16 | bromodomain containing 7 | N |
| ADCY7 | 16 | adenylate cyclase 7 | Y |
TXNIP, BRD7, and ADCY7 were the only genes enriched in CpG sites associated with all three glycemic exposures
BRD7 is a regulatory gene, that acts as an activator and binds to the ESR1 promoter, and is related to histone acetylation and chromativn structure regulation
ADCY7 is involved in cAMP production, a cellular signaler, and mediates glucagon and incretin hormone responses that regulate blood glucose, insulin secretion, and hepatic glucose production.
TXNIP glucose-sensitive regulator of pancreas function, hypomethylation at TXNIP is strongly associated with glycemic exposure
2 Functional Annotation
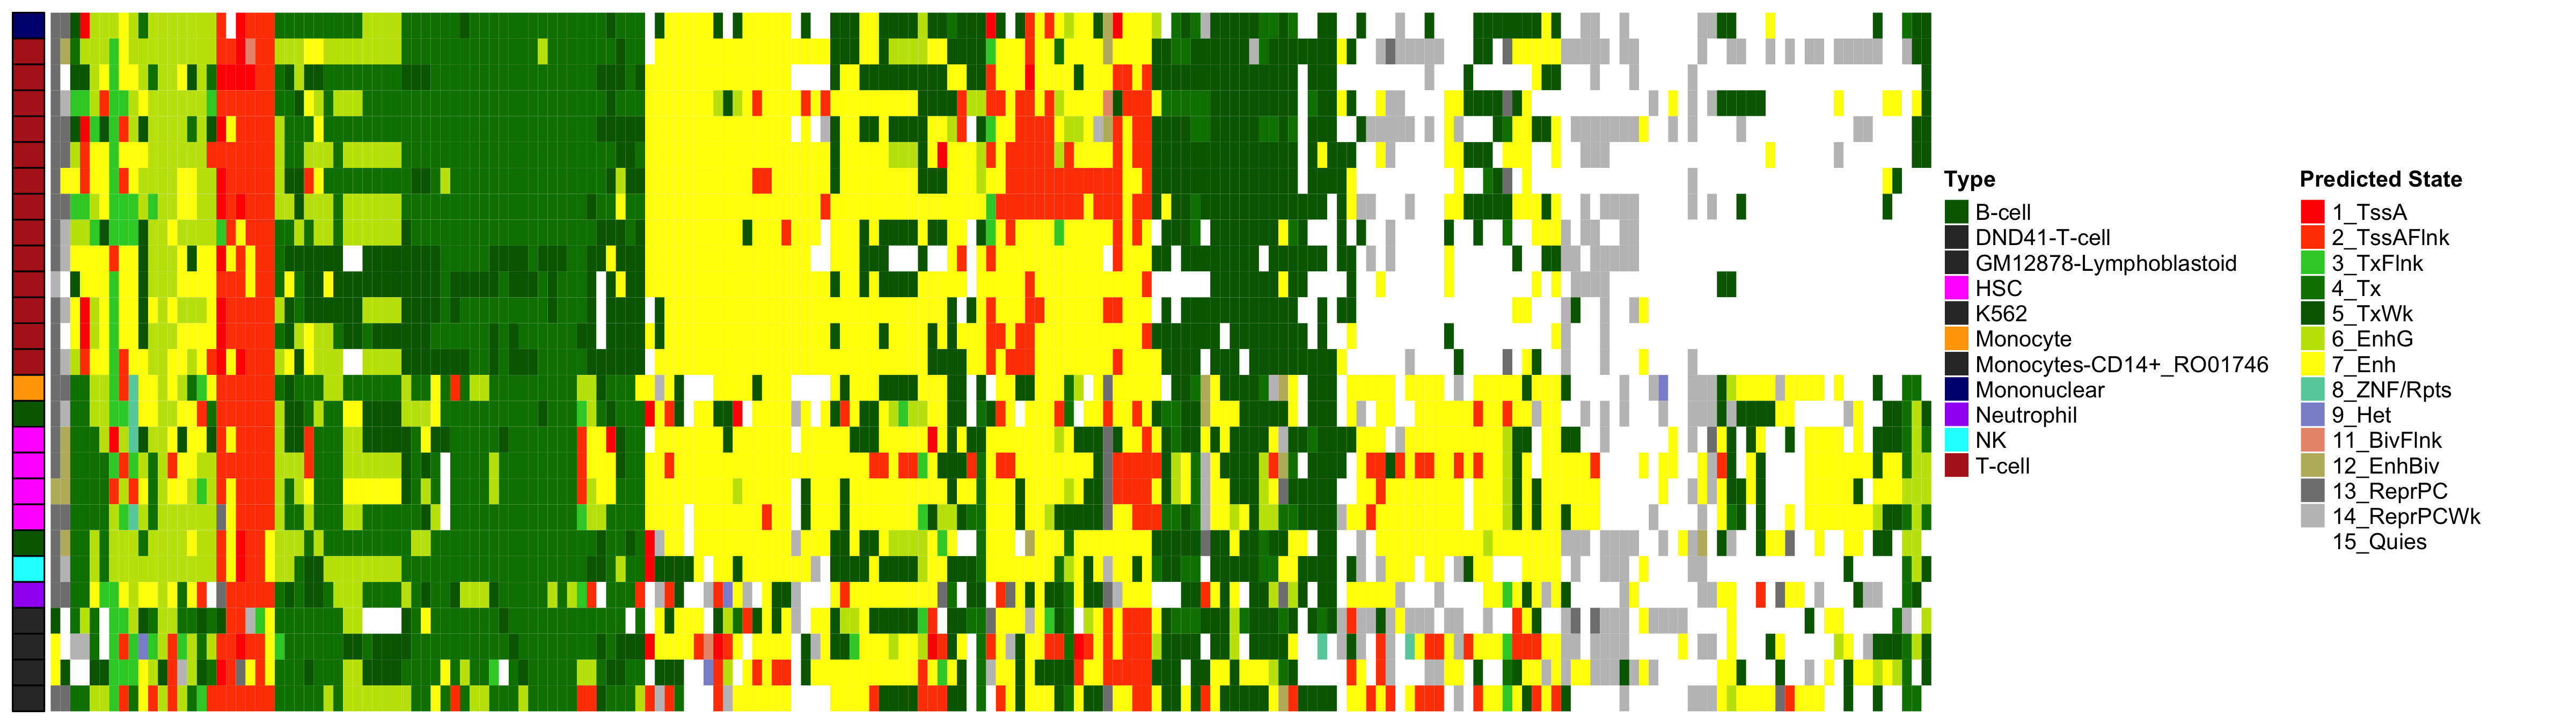
2.1 EWAS Functional Annotation - Excess HbA1c
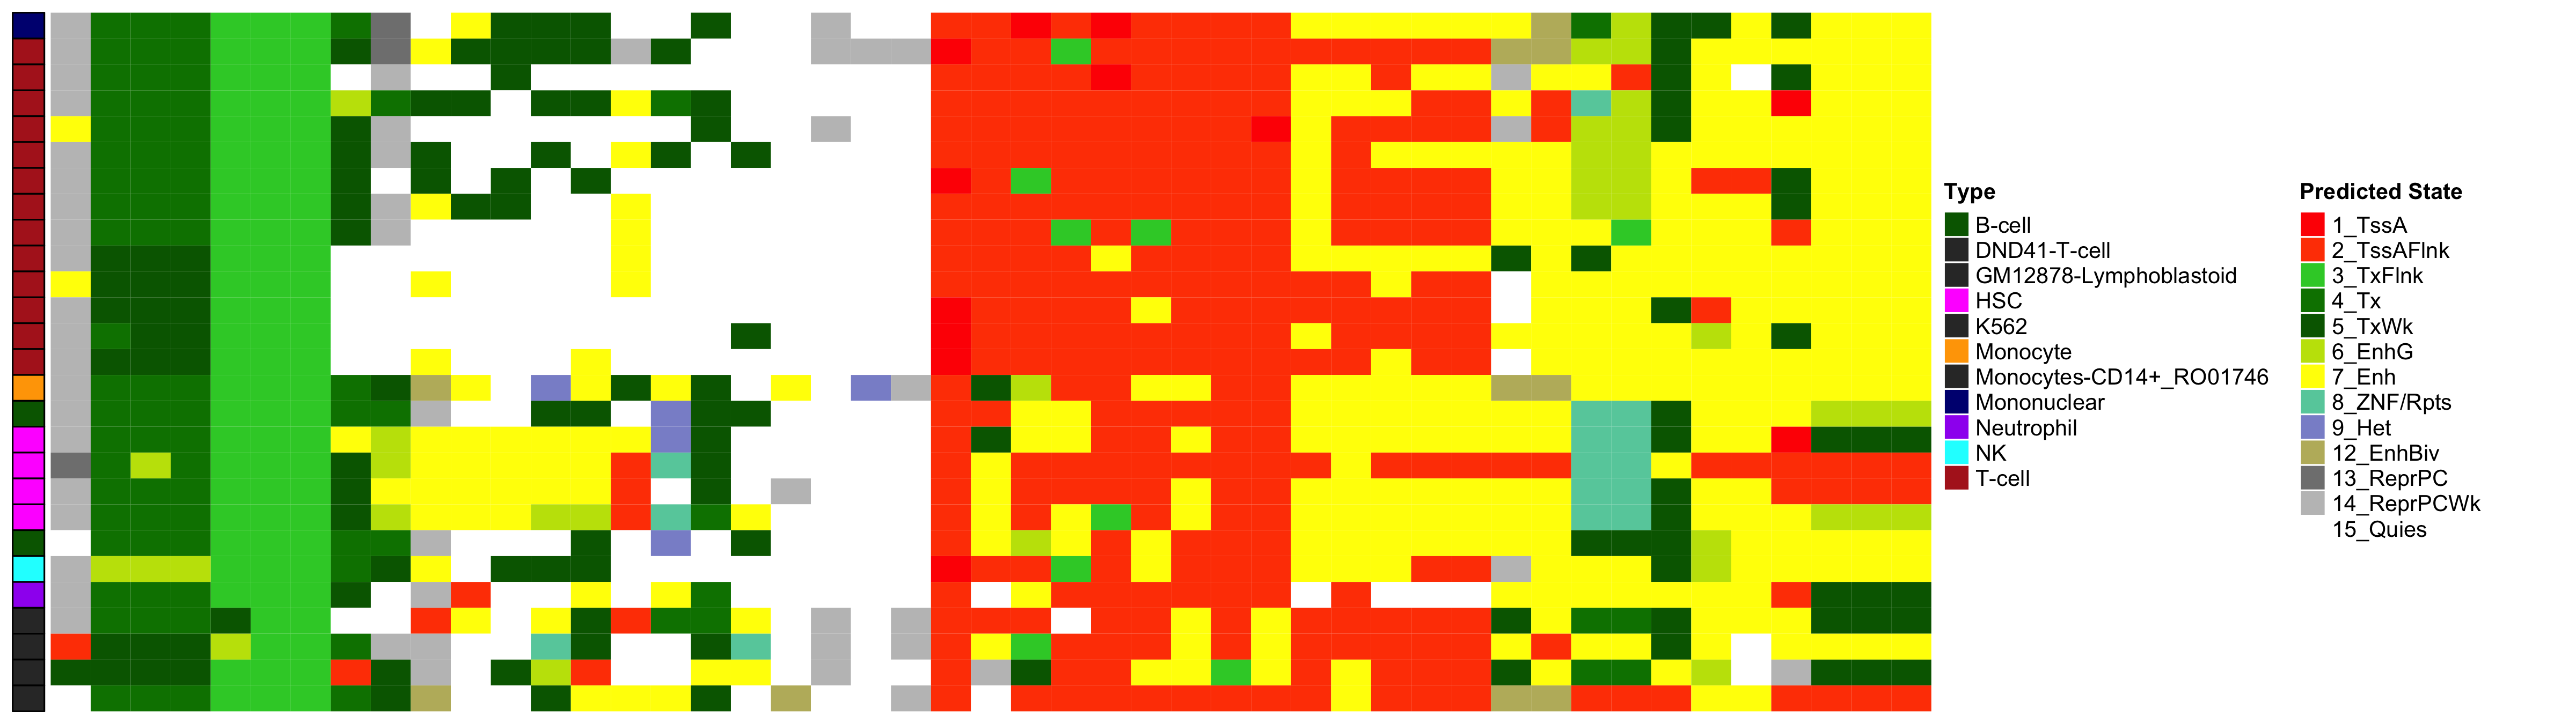
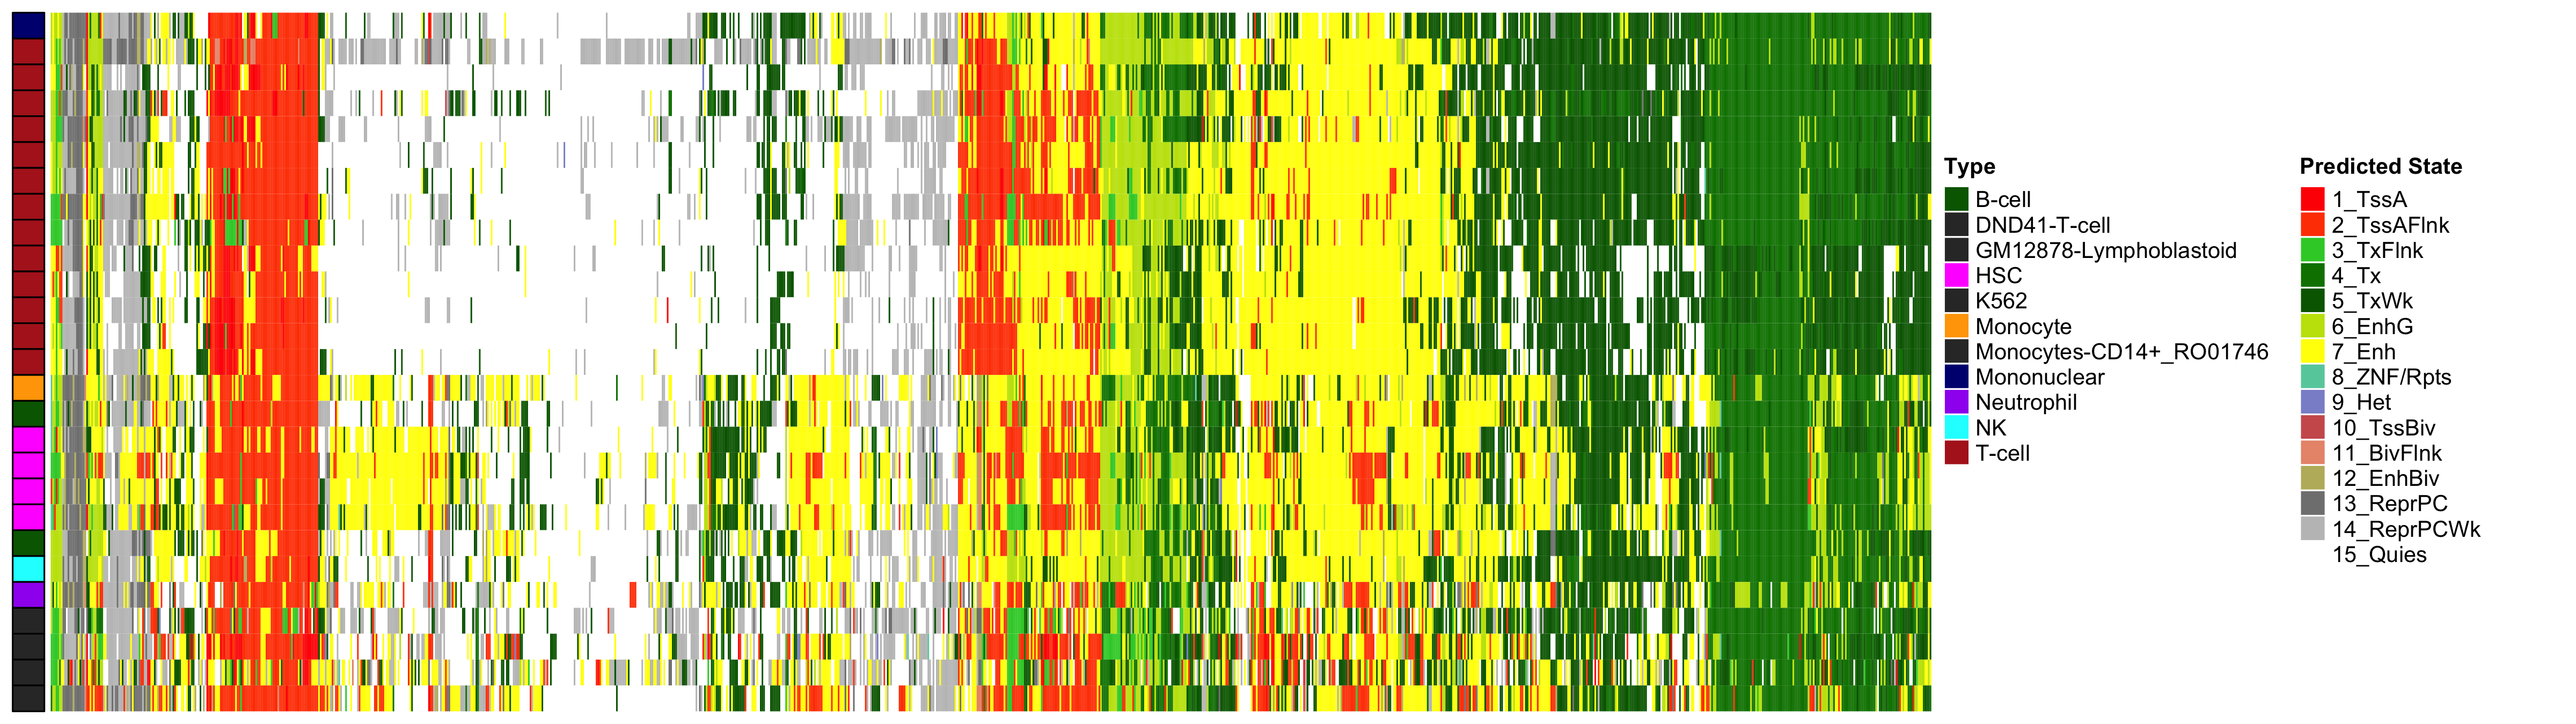 Heatmap of Chromatin States at CpGs associated with 5 Year Excess HbA1c
2.2 EWAS Functional Annotation - Mean HbA1c
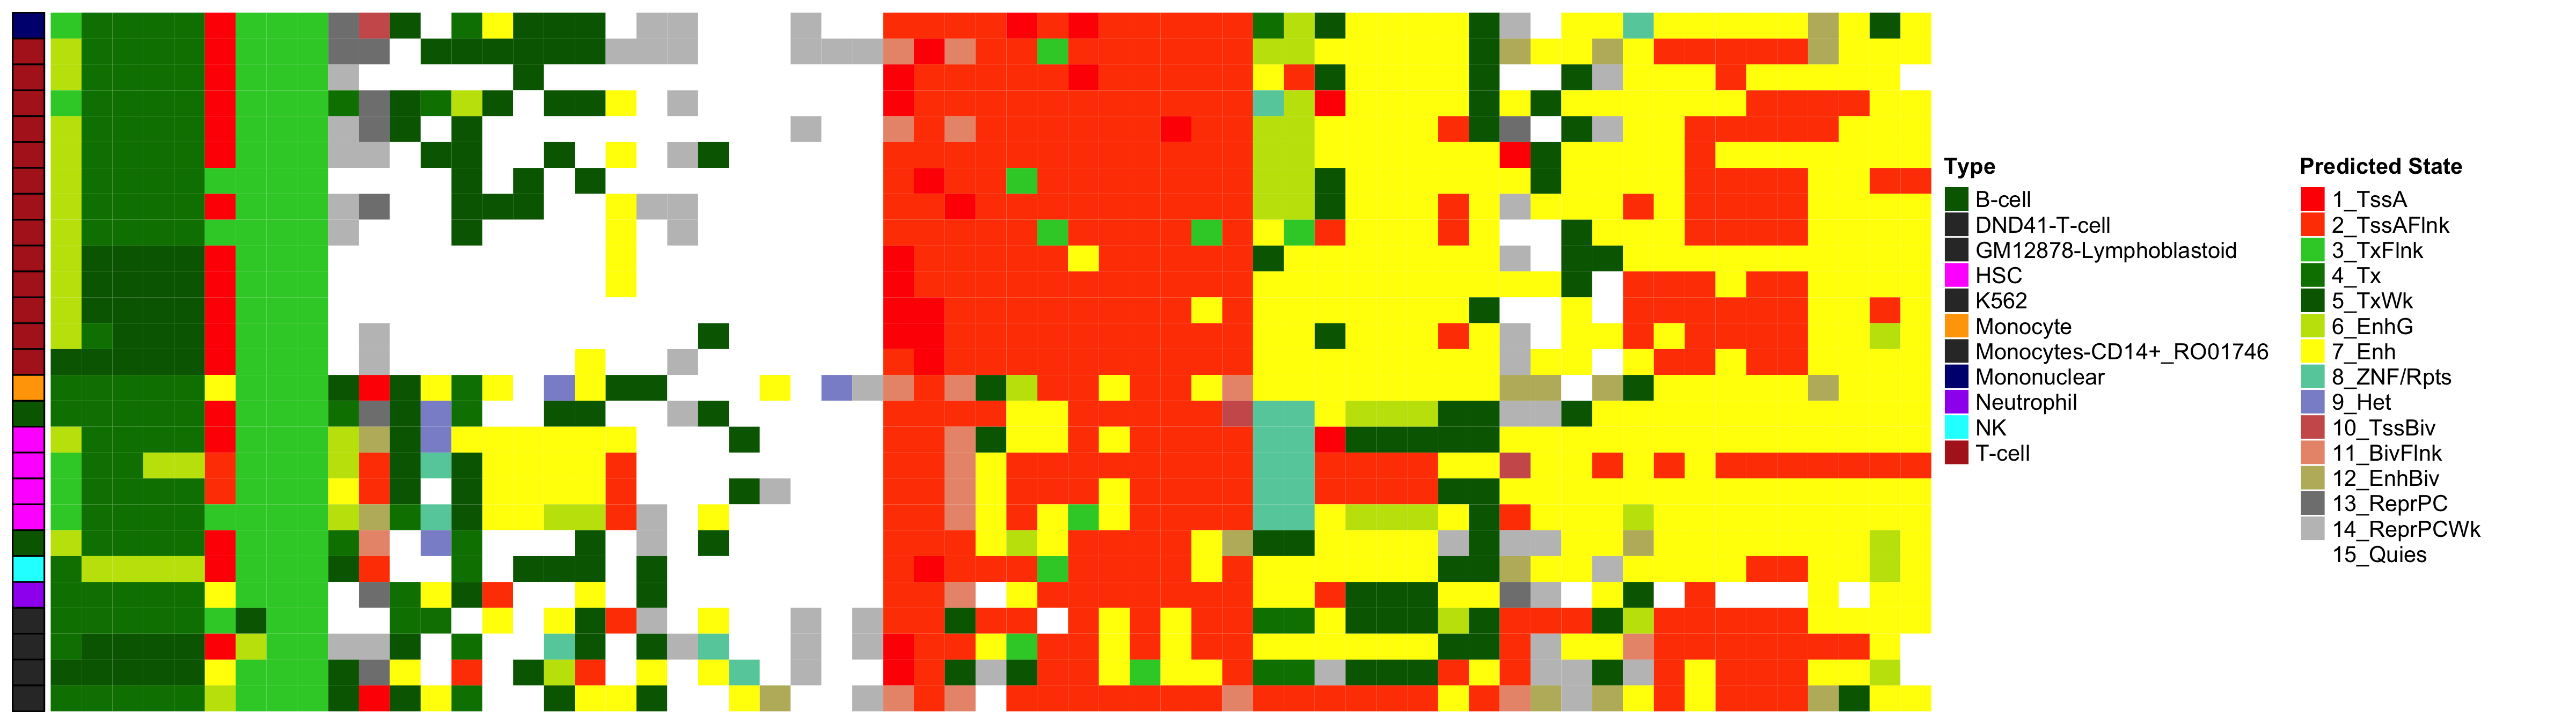
 Heatmap of Chromatin States at CpGs associated with 5 Year Excess HbA1c
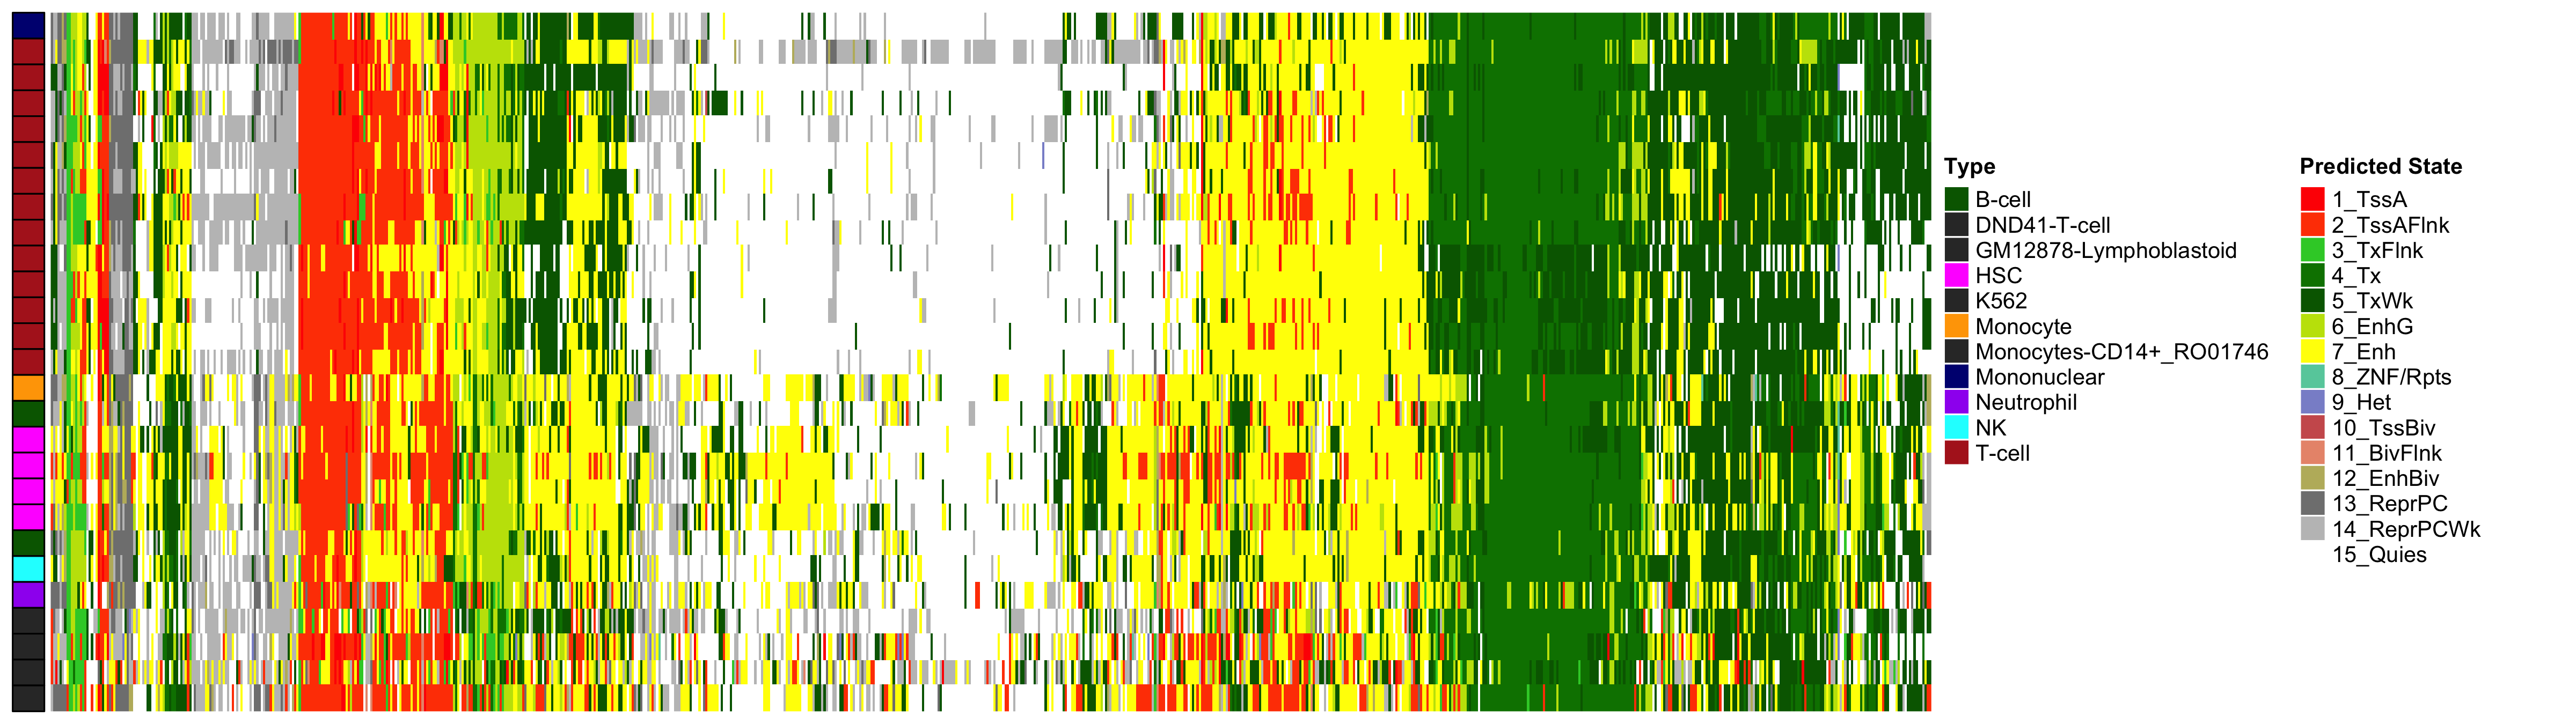
2.3 EWAS Functional Annotation - CV HbA1c
 Heatmap of Chromatin States at CpGs associated with 5 Year Excess HbA1c
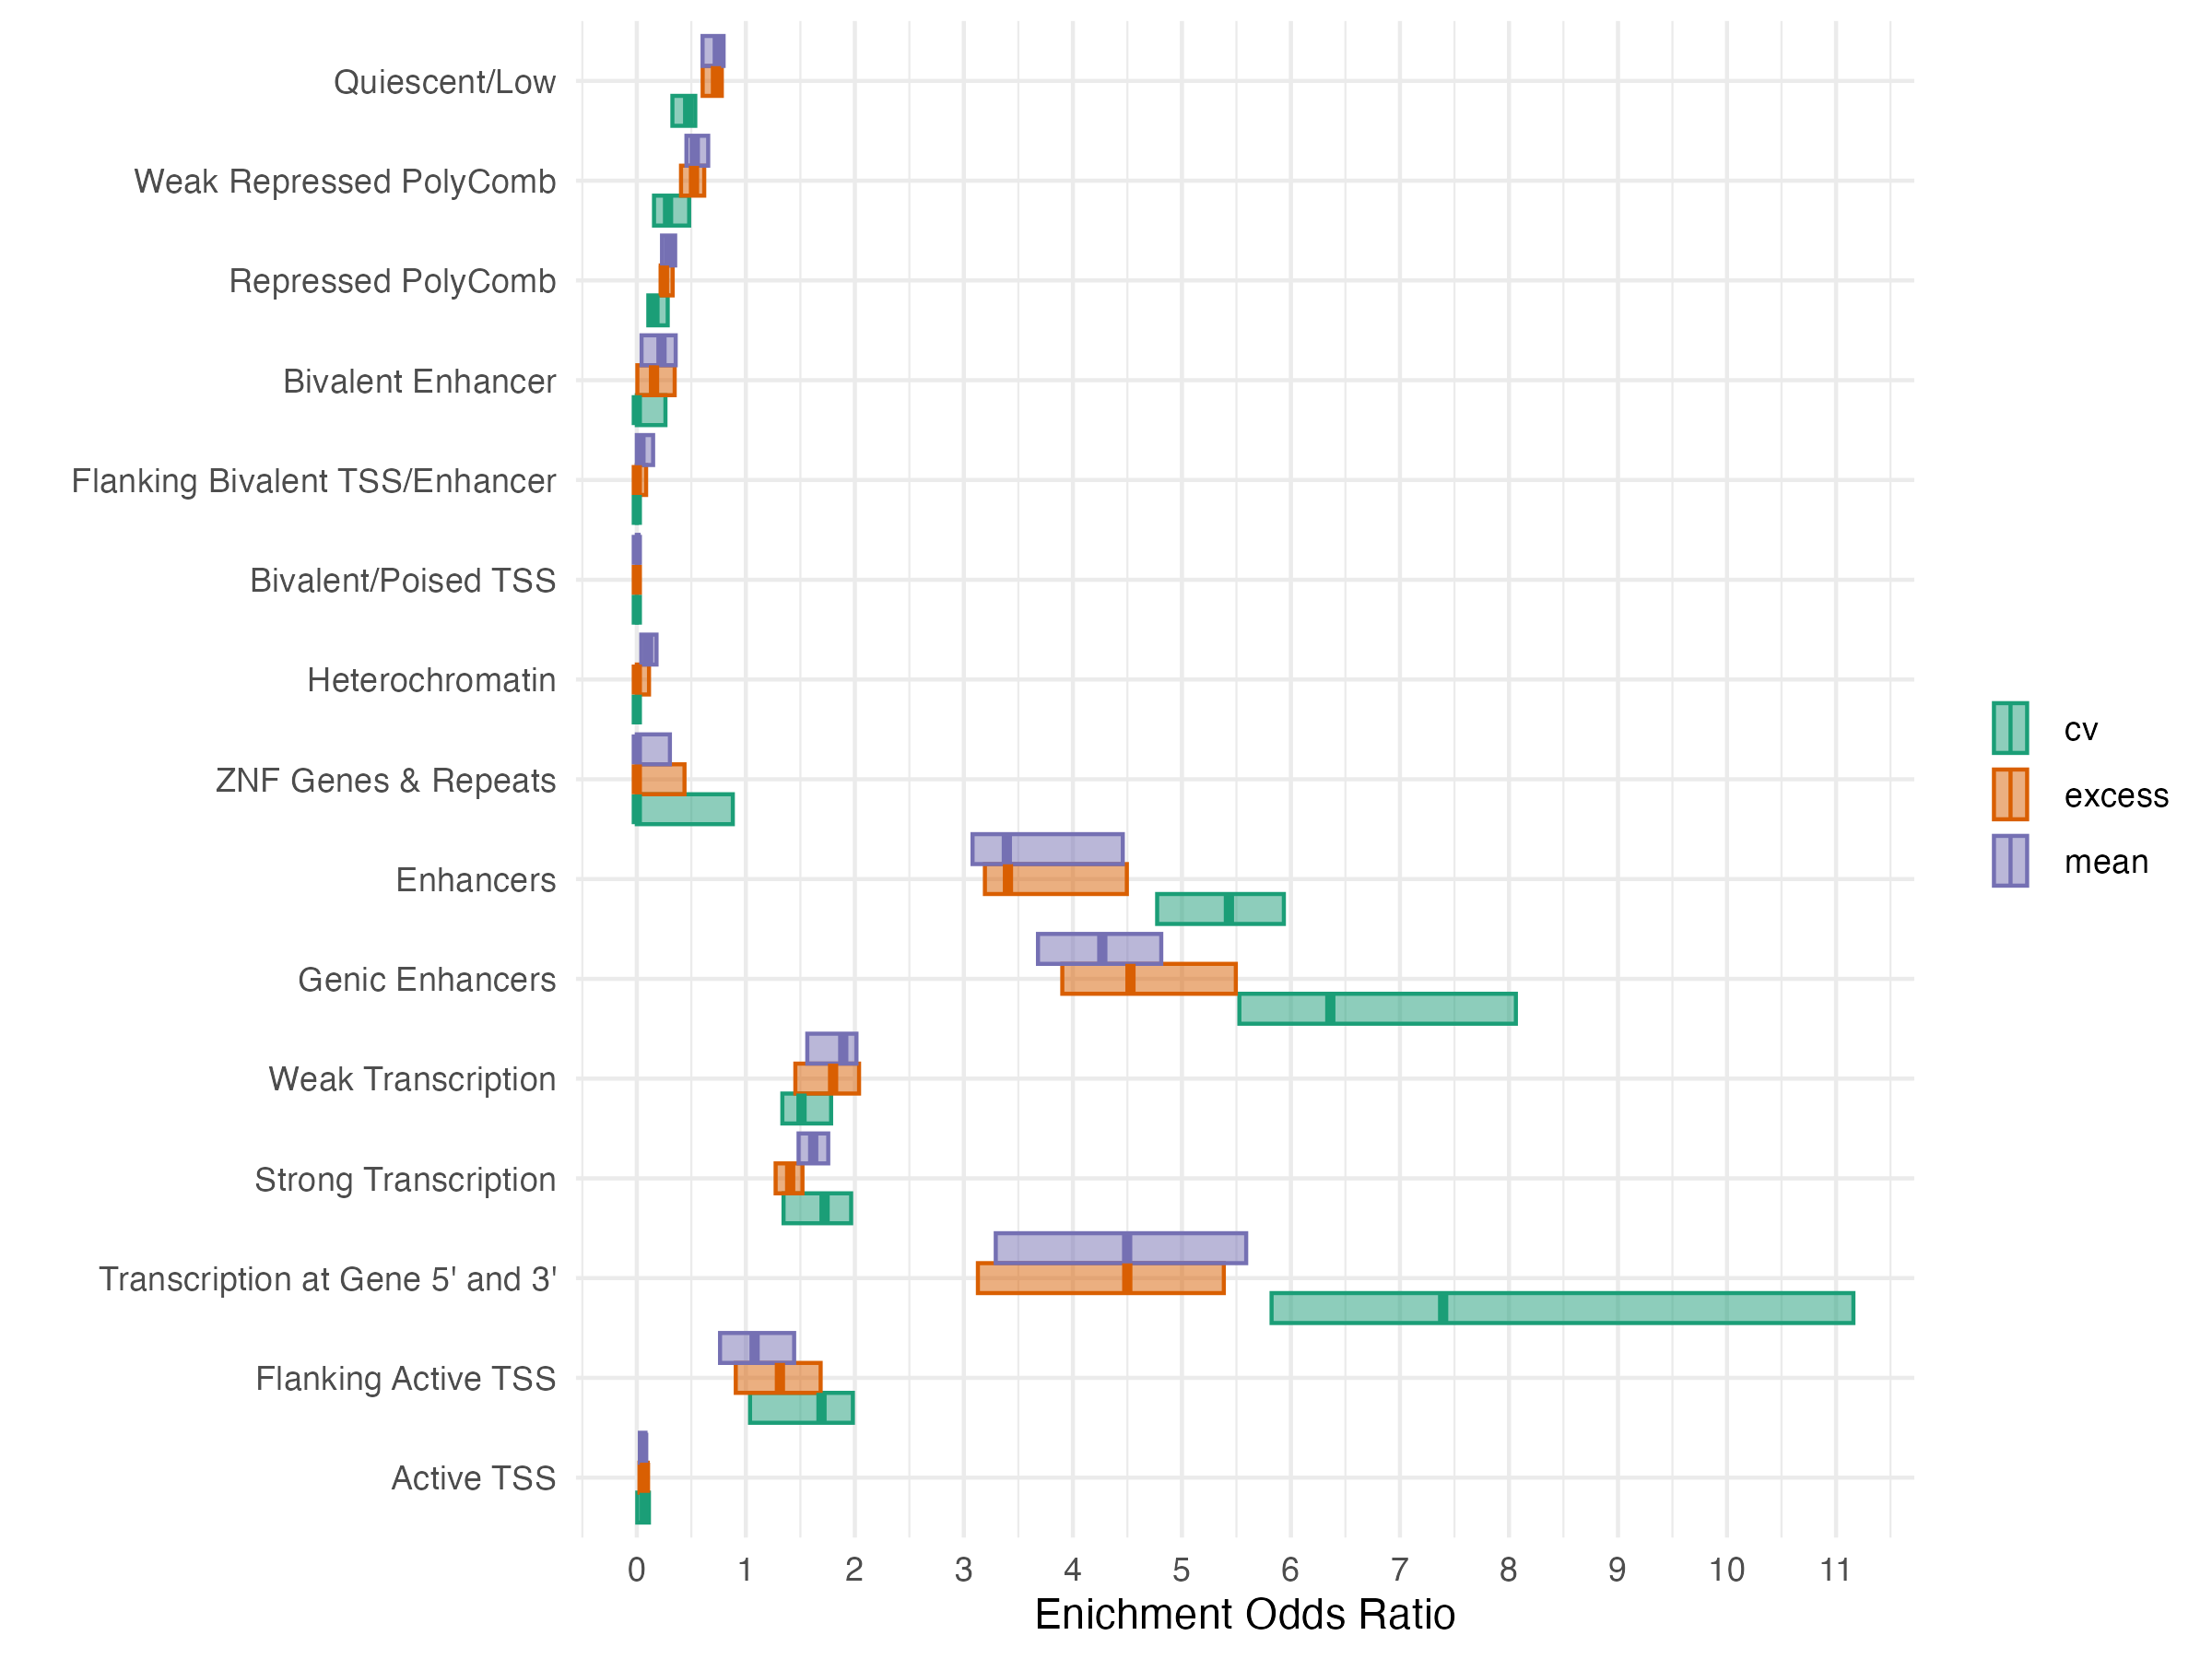
2.4 EWAS Functional Annotation - Chromatin State
3 Mediation Model
3.1 Outcome Model
\[ \begin{aligned} \text{Time to Diabetic Retinopathy} &\sim \text{Exposure + DNA Methylation + sex + age + BMI}\\ &\qquad + \text{Systolic Blood Pressure}\\ &\qquad + \text{Diastolic Blood Pressure}\\ &\qquad + \text{Blood Lipids}\\ &\qquad + \text{ Time since Diabetes Dx (years)} \end{aligned} \]
Time to retinopathy was modeled by an Weibull accelerated failure time model
Baseline BMI, blood pressure, and blood lipids (Total Cholesterol, HDL-C, Triglycerides) were defined as the nearest measurement to MVP blood sample collection, up to six months post blood-sample collection
- Subjects missing any baseline biomarkers were excluded
Subjects with any prior history of diabetic retinopathy were excluded
3.2 Causal Mediation Model

3.3 Causal Mediation
Exposure: \(A\), Glycemic Exposure
Mediator(s): \(M\), CpG site methylation
Outcome: \(T\), Time-to-Retinopathy following MVP sample collection
\[ \begin{aligned} M &= \beta_0 + \beta_1 A + \boldsymbol{\beta}_2^\top \mathbf{z} + \xi\\ \log(T) &= \theta_0 + \theta_1 A + \theta_2 M + \boldsymbol{\theta}_3^\top \mathbf{z} + \sigma \epsilon \end{aligned} \]
Causal Estimands
\[ \begin{aligned} \text{Natural Direct Effect} &: \operatorname{NDE}(a,\,a^*) = \theta_1 (a - a^*)\\ \text{Natural Indirect Effect} &: \operatorname{NIE}(a,\,a^*) = \theta_2 \beta_1 (a - a^*) \end{aligned} \] - We assume a symmetric one standard deviation difference about the sample mean for each exposure
3.4 Composite Null Hypothesis:
\[ \begin{aligned} \mathrm{H}_{01} &: \beta_1 = 0 \wedge \theta_3 \neq 0\\ \mathrm{H}_{10} &: \beta_1 \neq 0 \wedge \theta_3 = 0\\ \mathrm{H}_{01} &: \beta_1 = 0 \wedge \theta_3 = 0\\ \end{aligned} \]
Significance testing performed using
HDMTR package (Dai, Stanford, and LeBlanc 2022)Mediation P-value given by the maximum of the p-values associated with testing \(\beta_1 = 0\) and \(\theta_2 = 0\)
Max-P statistic: \(p_{\max} = \max\{\mathrm{Pr}[\beta_1 = 0],\,\mathrm{Pr}[\theta_2 = 0]\}\)
\(p_{\max}\) is not uniformly distributed under the null, HDMT procedure estimates the proportion of each type of null \(\pi_{01}, \pi_{10}, \pi_{00}\) to control family-wise error and false discovery rate
3.5 Causal Mediation - Indirect Effects
3.6 Causal Mediation - Indirect Effects
- Max-P statistic is severely underdispersed relative to a uniform null distribution
| Exposure | NDE Estimate | Proportion Mediated |
|---|---|---|
| Excess | -0.500 (-0.504, -0.498) | 0.0121 (0.00997, 0.0143) |
| Mean | -0.535 (-0.538, -0.531) | 0.0108 (0.00990, 0.0118) |
| CV | -0.197 (-0.200, -0.192) | 0.0221 (0.01232, 0.0495) |
3.7 Causal Mediation - Volcano Plot
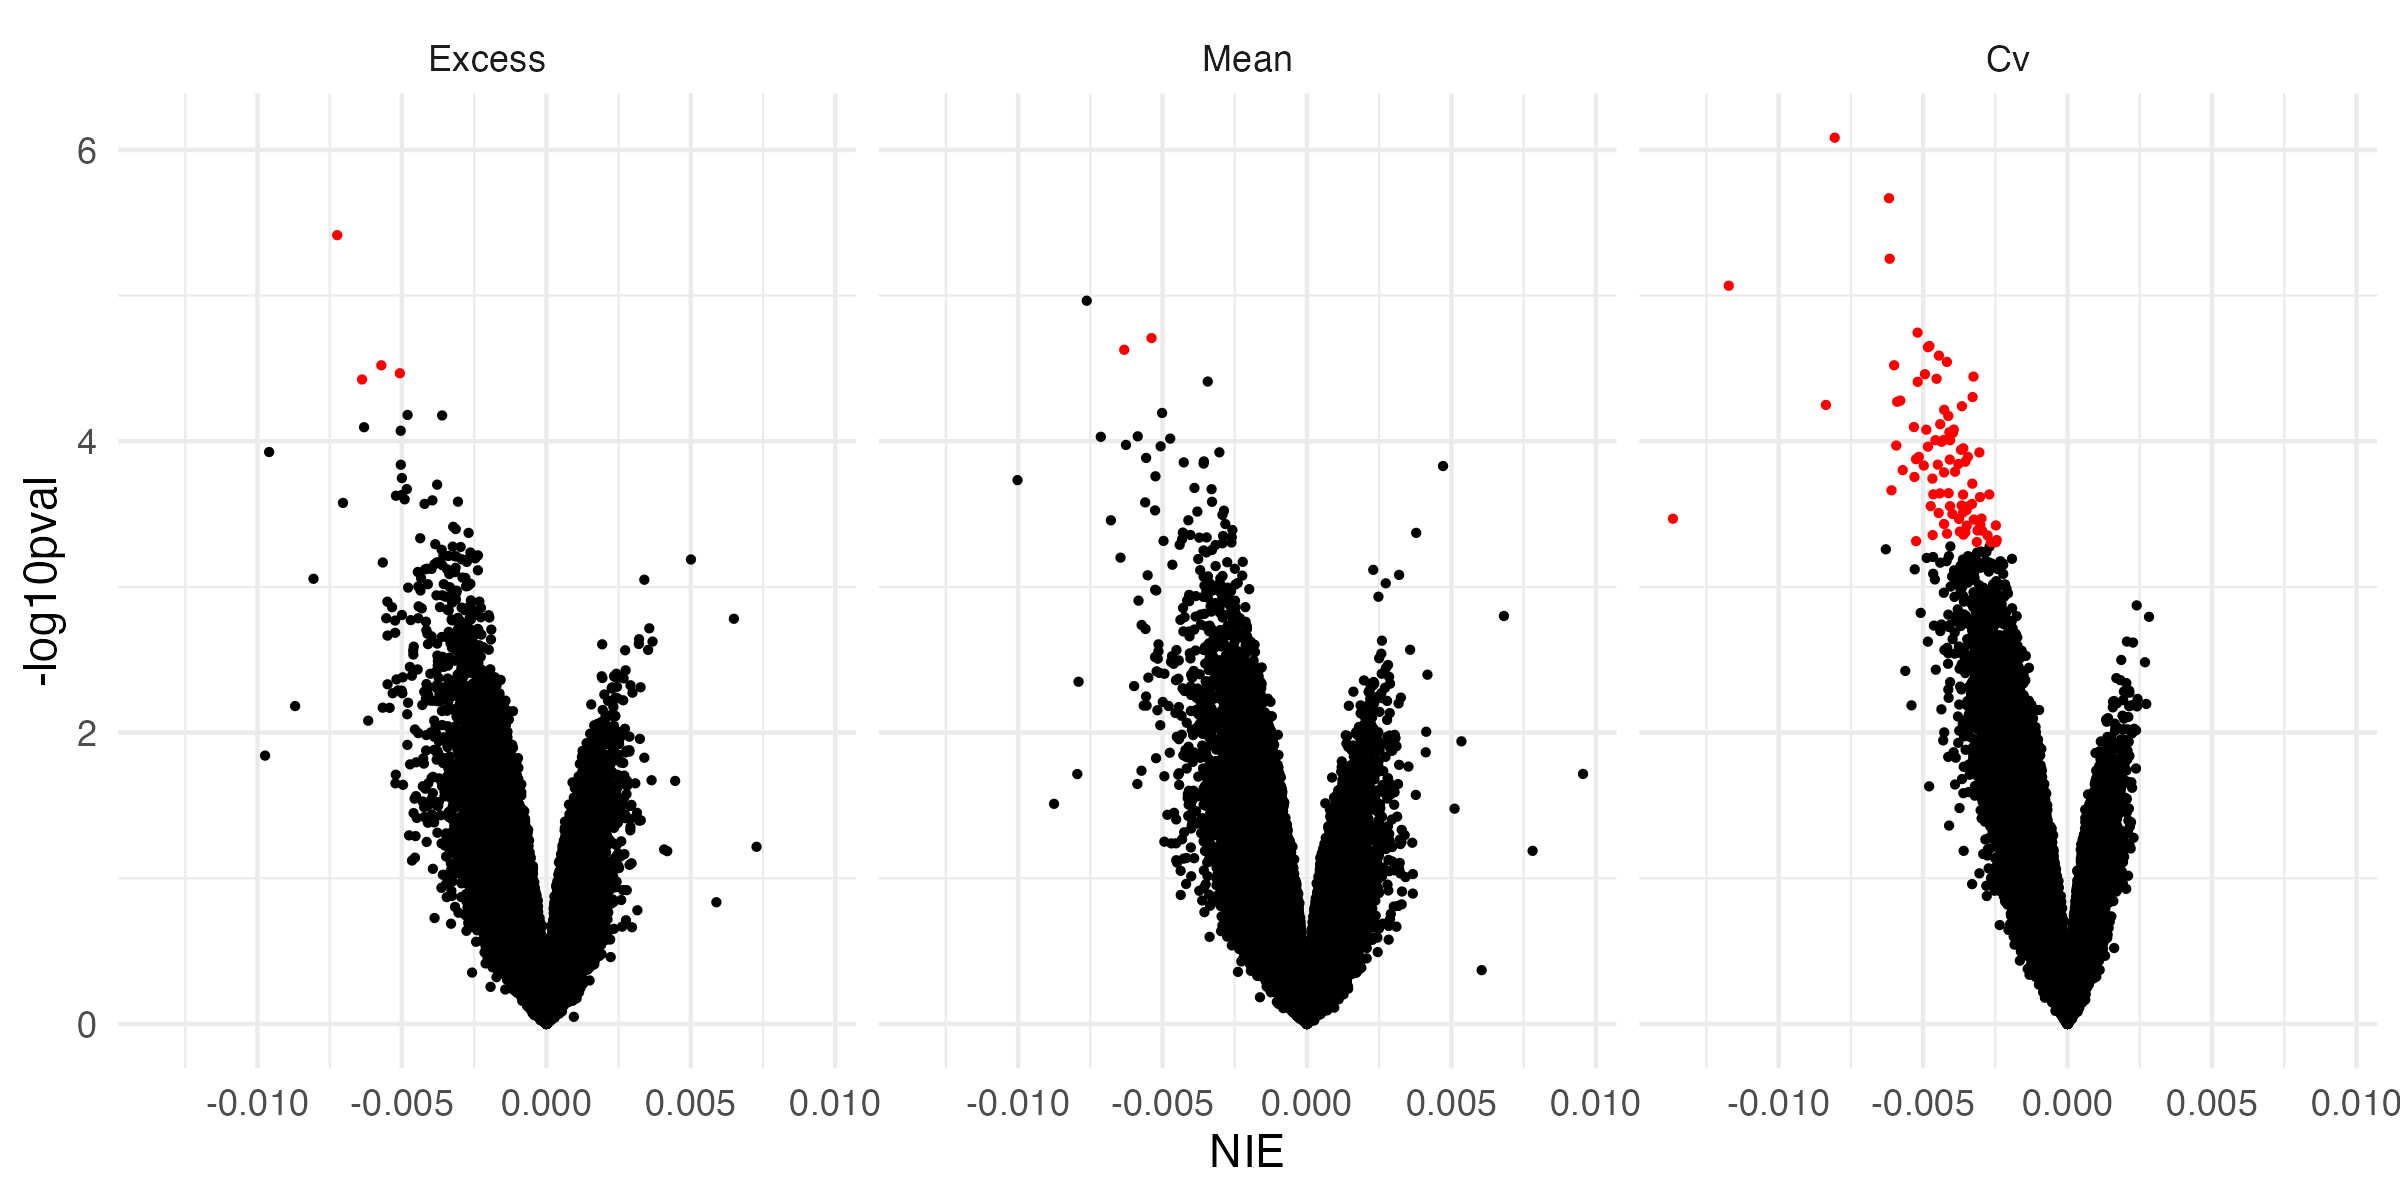
- At all significant mediators, increased glycemic exposure is associated with a decrease in time-to-retinopathy
3.8 Causal Mediation - Indirect Effects
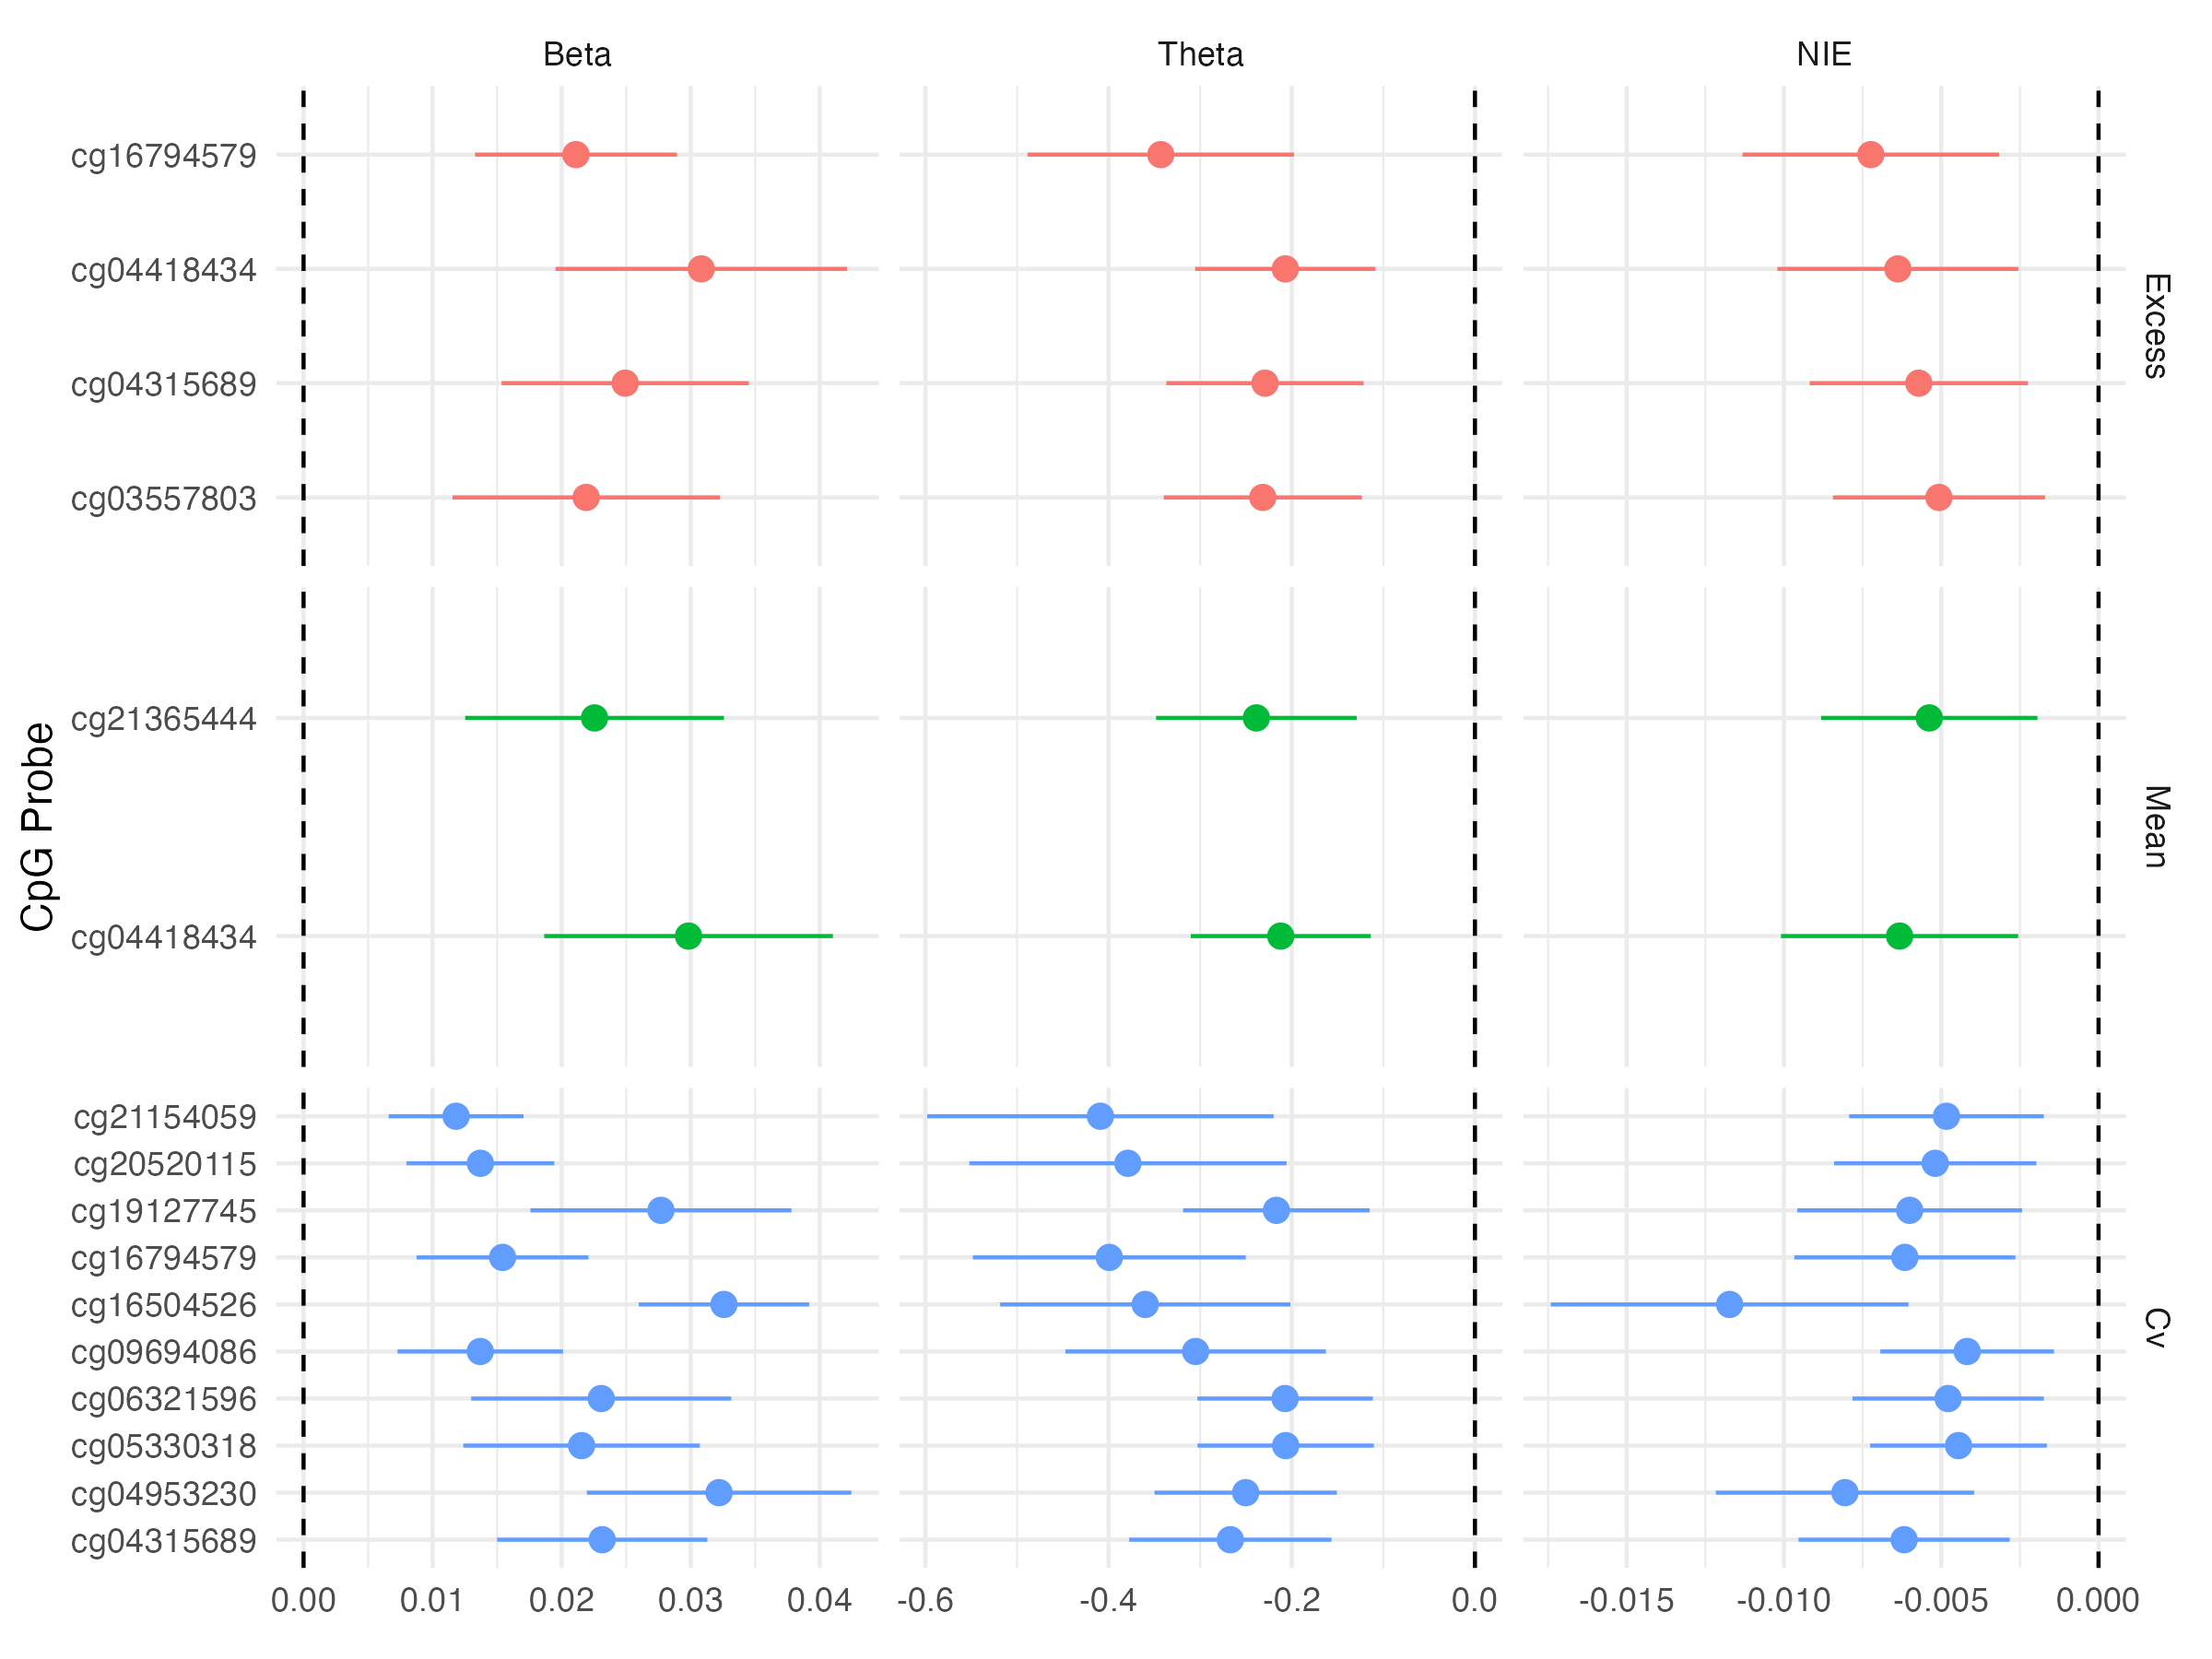
Expected changes in methylation given changes in glycemic exposure appear to be relatively small
Individual CpG sites do not capture much of a mediation effect of glycemia on time-to-retinopathy
Mean and excess HbA1c effect on retinopathy onset is marginally mediated by methylation at two and four CpG sites, respectively
- Mean and excess HbA1c are associated with
cg04418434is hypermethylated in the 5’UTR region of RREB1 cg04418434is hypermethylated in the 5’UTR region of RREB1
- Mean and excess HbA1c are associated with
CV HbA1c’s effect on DR onset is mediated at 87 CpG sites
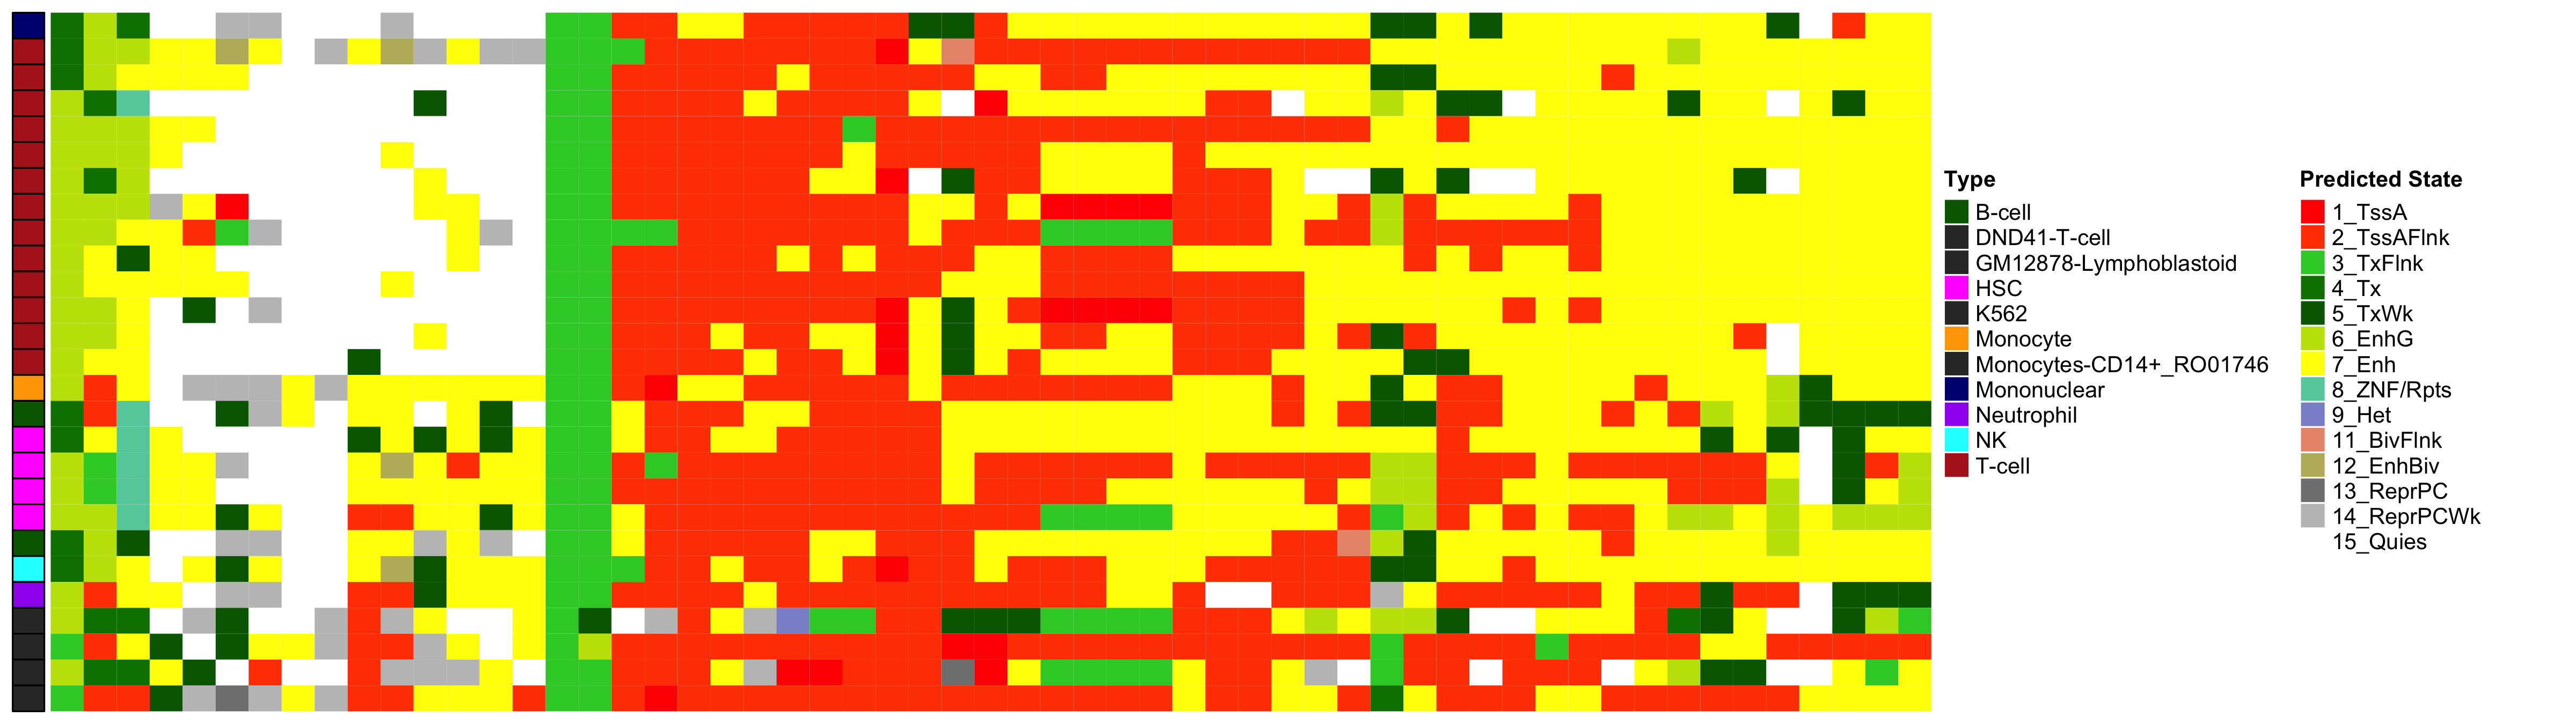
3.9 Causal Mediation Annotation
- Top genes with CpG sites that mediate glycemic exposure on time to retinopathy
| Gene | Name | CHR | Mean | Excess | CV | Gene Region |
|---|---|---|---|---|---|---|
| ARF1 | ADP Ribosylation Factor 1 | 1 | X | 5’UTR | ||
| MALAT1 | Metastasis Associated Lung Adenocarcinoma Transcript 1 | 11 | X | Body | ||
| ELF1 | E74 Like ETS Transcription Factor 1 | 13 | X | 5’UTR | ||
| XYLT1 | Xylosyltransferase 1 | 16 | X | X | Body | |
| HK2 | Hexokinase 2 | 2 | X | Body | ||
| DGUOK-AS1 | DGUOK Antisense RNA 1 | 2 | X | X | Body | |
| RREB1 | Ras Responsive Element Binding Protein 1 | 6 | X | X | 5’UTR | |
| KLF9 | KLF Transcription Factor 9 | 9 | X | Body |
ARF1, MALAT1, ELF1, RREB1, KLF9 all have either been found to be expressed in retinal tissue or have also been shown to be associated with retinal disease or macular degeneration
XYLT1 has been previously been associated with age-related macular degeneration
DGUOK-AS1 has been previously been found to be associated with several cancers, but association with retinopathy appears to be novel
3.10 Further Work
Mediation analysis of time to renal disease onset in T2D is ongoing
Joint mediation analysis to be performed considering all marginally significant mediators together, to capture the overall mediaiton effect
Mediation analysis of DR progression: 16-17% of T2D patients with retinopathy in MVP prior to blood sample collection later develop diabetic macular edema, an advanced complication of retinopathy
References
Footnotes
interval between the date of the first DM diagnosis code to MVP sample collection date↩︎